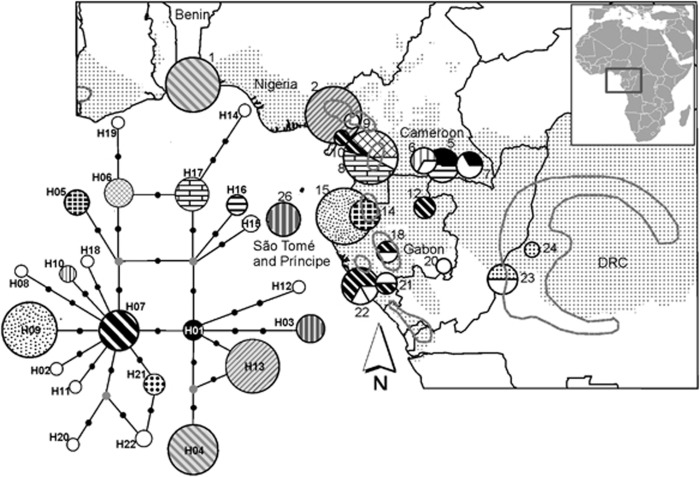
Figure 2.
Distribution of psbA-trnH haplotypes of S. globulifera. Chart size increases with sample size (ranging from 1 to 14 individuals). Grey lines delimit postulated refuge locations during the LGM (about 18 000 years BP) adapted from Maley (1996). A grey background colour indicates haplotypes found in Benin, Cameroon Korup and in São Tomé, to facilitate comparison with the map of SSR GPs (Figure 1). Numbers correspond to sampling locations in Tables 1 and 2. Haplotypes detected in one or two samples in a single population only are marked in white. Lower left: Haplotype network with haplotype numbers in bold (small black circles indicate mutations; small grey circles indicate putative haplotypes not observed in this study).

