Abstract
It has been recently suggested [N. E. Marotta and L. A. Bottomley, Appl. Spectrosc. 64, 2010, 601-06] that previously reported SERS spectra of vegetative bacterial cells are due to residual cell growth media that were not properly removed from samples of the lab cultured microorganism suspensions. SERS spectra of several commonly used cell growth media are similar to those of bacterial cells as shown here and reported elsewhere. However, a multivariate data analysis approach shows that SERS spectra of different bacterial species grown in the same growth media exhibit different characteristic vibrational spectra, SERS spectra of the same organism grown in different media display the same SERS spectrum, and SERS spectra of growth media do not cluster near the SERS spectra of washed bacteria. Furthermore, a bacterial SERS spectrum grown in a minimal medium, which uses inorganics for a nitrogen source and displays virtually no SERS features, exhibits a characteristic bacterial SERS spectrum. We use multivariate analysis to show how successive water washing and centrifugation cycles remove cell growth media and result in a robust bacterial SERS spectrum in contrast to the previous study attributing bacterial SERS signals to growth media.
Keywords: SERS, principle component analysis, bacteria, diagnostics
Introduction
The potential for using the optical signature resulting from a surface enhanced Raman spectrum for the detection and identification of whole vegetative bacterial cells has been demonstrated by several research groups over the past few years.1-22 The successful development of a surface enhanced Raman spectroscopy (SERS) based methodology for the species and strain specific identification of bacterial cells could have enormous impact for development of a rapid, easy-to-use, point-of-care pathogen diagnostic platform. SERS offers some unique advantages with respect to other optical and non-optical techniques as a method for bacterial infectious disease identification. The enormous Raman signal enhancement permits the acquisition of SERS spectra at the near single bacterial cell limit on a time scale of seconds without the need for sample amplification by growth or polymerase chain reaction (PCR) methods and without the need for extrinsic labeling. SERS-based bacterial identification can be achieved rapidly by minimally trained personnel and is less subject to contamination than PCR approaches which rely on sample amplification. Since low incident laser power (1 – 5 mw) is required for SERS data acquisition due to the large Raman enhancement effect, relatively low cost, portable SERS platforms for point-of-care diagnostics may be developed. Furthermore, the near diffraction limited spatial resolution afforded by microscopy potentially allows SERS specificity to be applicable for the analysis of bacterial mixtures.
In previous reports we have shown that SERS spectra of bacterial cells grown in a variety of cell growth media exhibit unique SERS signatures that allows their identification when combined with multivariate data analysis techniques.9,18 While a number of SERS substrates have been demonstrated to provide bacterial SERS spectra, the largest bacterial SERS signals we have observed were obtained on Au nanoparticle covered SiO2substrates resulting from an in-situ metal ion doped sol-gel process.8 Sample signal data acquisition times are ~10 seconds with about a mw of 785 nm incident laser power focused and collected by a 50× objective. Single cell level sensitivity has been achieved on these substrates.8 Reproducible SERS spectra have been shown to allow the development of libraries that allow diagnostic identification of bacterial species and strains.18 Furthermore, we have previously demonstrated that media cultured bacteria that have been spiked into human blood, enriched following a centrifugation lysis procedure, also result in species specific SERS signatures.9
The chemical/molecular identity of these bacterial SERS vibrational bands has not yet been established. Due to the distance dependence of the SERS enhancement mechanism it has been generally assumed that the observed vibrational bands appearing the SERS spectra of whole vegetative bacterial cells is dominated by the contributions of cell wall components, such as peptidoglycan, lipids, lipopolysaccharides or membrane proteins of the outer cell layers. However, this hypothesis has not been proven. As an example of the current understanding of these bacterial SERS spectra, the generally strongest band observed in red-excited bacterial SERS spectra at ~ 730 cm−1 has been variously assigned to the ring stretching mode of adenine3,12 or adenosine,19 the flavine adenine dinucleotide,17 the glycosidic ring of polysaccharides such as N-acetyl-D-glucosamine (NAG) and N-acetylmuramic acid (NAM), components of peptidoglycan,6,7,15 or a symmetric O–P–O vibrational mode of the phosphate group20.
In a recent study by Marotta and Bottomley23 the SERS spectra of bacterial cell growth media and bacterial cells cultured in these same media on Ag nanorod substrates have been reported. The observed SERS spectra of the vegetative bacterial cells are similar to those reported previously by other groups, but also suspiciously resemble SERS spectra of several of cell growth media alone once they have been diluted in water. These workers however do not follow the standard sample bacterial preparation protocol of repeated cycles of washing with pure water and centrifugation but instead acquire SERS spectra of diluted bacteria cultures. Marotta and Bottomley23 attribute the expected bacterial SERS signature to contributions from the cell wall structures, as described above. Based on: (1) the similarity between growth media and bacterial SERS spectra, (2) the similarity of Gram-positive and Gram negative bacterial SERS signatures, (3) the spatial distribution of SERS signals on the SERS substrate, and (4) dilution dependence of SERS signals, these authors23 argue that the SERS spectra previously reported of bacteria are probably not due to inherent chemical features of the bacterial cells themselves, but in all likelihood, trivially result from residual cell growth media which has not been fully removed from the bacterial sample solutions or cell growth media that remains adsorbed to the outer walls of these bacterial cells despite multiple cell washing cycles.23 Thus the authors suggest that the SERS methodology for identification of bacterial species/strains may have been flawed in the previous studies and that any observed spectral differences reported for the SERS spectra of a given bacterial species could simply result from contributions of different types or amounts of cell media components directly. Marotta and Bottomley23 thus conclude that if this hypothesis were correct, the best strategy would be to develop only Raman based diagnostics that are media free, such as confocal non-SERS Raman or optical tweezer based Raman techniques because SERS spectra of vegetative bacterial cells appear to be dominated by cell growth media.
The purpose of this report is to provide data to quantitatively test the hypothesis that SERS bacterial spectra are due to the residual growth media that has not been completely washed from bacterial solutions or surfaces. More specifically, we report on the SERS spectra of typical cell growth media and use multivariate data analysis methods to compare SERS spectra of laboratory cultured bacteria with the SERS spectra of the media they are grown in. Furthermore, the limited data represented by these data serve also to address the question as to the dependence of bacterial cell SERS spectra on cell growth media more generally. Although not the main subject of this report the analysis presented here calls into question the assumed explanation for the origins of the bacterial SERS spectra. A report on the molecular origins of the SERS spectra of bacteria will be the subject of a subsequent manuscript from this laboratory.
The unequivocal conclusion the data here support is that although the SERS spectra of some cell growth media indeed resemble the SERS spectra of well washed bacterial cells the bacterial SERS signatures are not due to contamination from the medium and result from inherent, species and strain specific biochemical activity. The SERS spectra of bacteria are readily distinguished from that of cell growth media and proper water washing protocols are shown to effectively remove cell growth media as evidenced by multivariate data analysis. The similarity in the SERS signatures arises from the molecular origins of the bacterial and some growth media SERS spectra.
Experimental Procedures
Bacterial strains, growth media and sample preparations
The bacterial strains used in these studies and their sources are summarized in Table 1. Bacterial strains were grown in ~ 15 mL of growth media broth (typical OD ~1) and harvested during the log growth phase by centrifugation and washed 3 - 4 times with deionized Millipore water. The resulting cell pellet was resuspended in 0.25 mL of water and 1μL of the resulting ~109/mL bacterial suspension was pipeted directly onto the SERS substrate for purposes of the data analysis described here. SERS measurements were made, usually, after about two minutes when nearly all the water had evaporated.
Table 1. Summary of bacterial strains used in these SERS studies.
| Bacterial Species | Strain ID | Source |
|---|---|---|
| K. pneumoniae | 11998 | BD Technologies |
| S. aureus | USA300 | ATCC |
| S. aureus | NCTC 8325 | Microbiotix, Inc |
| E. coli | 29425 | ATCC |
| E. coli | 11996 | BD Technologies |
| P. aeruginosa | P14 | Microbiotix, Inc |
| E. faecalis | 29212 | ATCC |
SERS substrates
Substrates resulting from an in-situ Au ion doped SiO2sol-gel procedure previously developed in our laboratory8 were used to acquire all the SERS spectra reported here. This procedure results in small (2 – 15 particles) aggregates of monodispersed ~80 nm Au nanoparticles covering the outer layer of ~1mm2 SiO2 substrate. Details concerning the production of these SERS active chips and the characterization of their performance for providing reproducible and strongly enhanced (single cell level) SERS spectra of bacteria when excited by a few milliwatts of 785 nm radiation have been previously described.8 The shelf life of these sol-gel based substrates is currently ~ 5 months.
Data acquisition
All of the spectra shown here were acquired with the RM-2000 Renishaw Raman microscope employing a 50× objective and excited at 785 nm. SERS spectra were obtained with ~2 mw of incident laser power in ~10 seconds of illumination time. The 520 cm−1 band of a silicon wafer was used for frequency calibration.
Multivariate data analysis
As shown previously,18 a second derivative based barcode protocol results in enhanced principle component analysis (PCA) specificity and reproducibility as compared to PCA analysis based on spectral intensity, first or second derivatives. In this procedure, after Fourier filtering high frequency noise from the normalized spectra, a barcode or binary vector is created based on the sign of the second derivative of the observed SERS spectrum. The input vector of 0’s or 1’s is then used to perform the PCA analysis. More details and demonstrations of the efficacy of this barcode procedure can be found elsewhere.18 This barcode multivariate data analysis procedure will be used here to quantitatively assess the relationship between the SERS spectra of bacterial cells and those of their growth culture media.
Results and Discussion
SERS spectra of washed bacteria and culture media
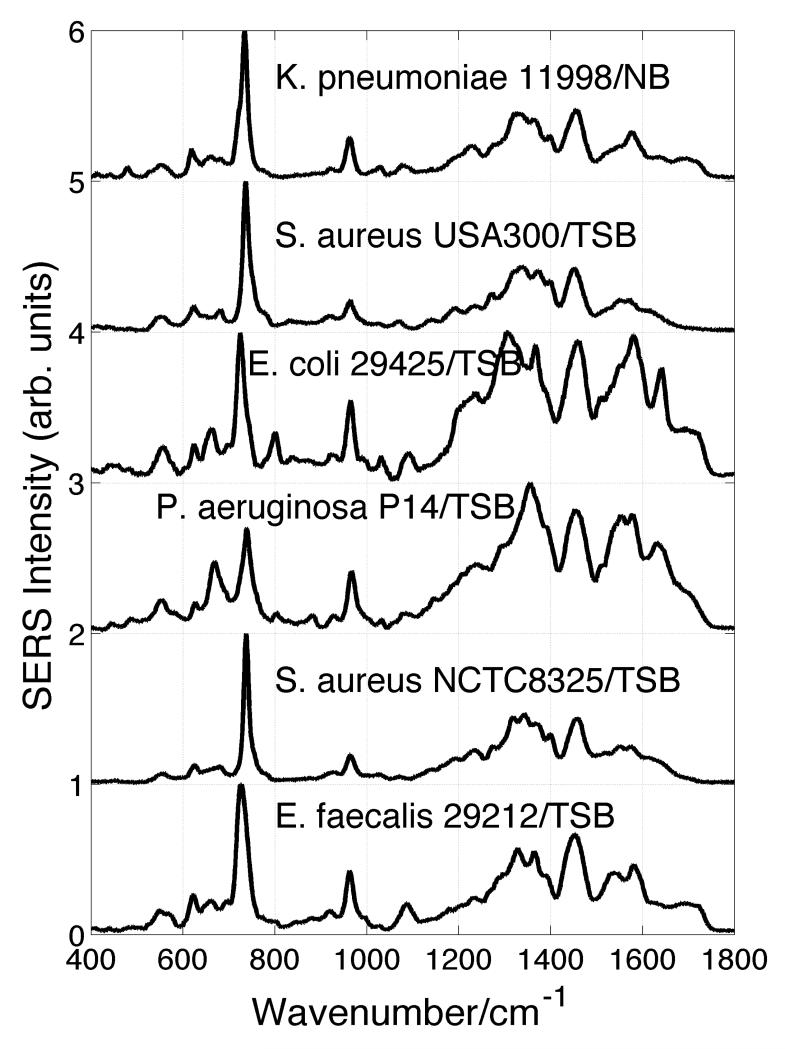
SERS spectra of five bacterial species, K. pneumonia, E. coli, P. aeruginosa, E. faecalis including two strains of S. aureus, are shown in Fig. 1. The growth media used to culture the indicated strains of these representative bacterial species are indicated in this figure as well. All except the K. pneumonia have been grown in trysic soy broth (TSB). The K. pneumonia was cultured in nutrient broth (NB) media. E. coli, K. pneumonia and P. aeruginosa are Gram-negative, and S. aureus and E. faecalis are Gram-positive bacteria. This classic Gram staining characterization delineates bacterial types on the basis of outer wall structure.24 As evident in this figure, the representative bacterial SERS spectra share a number of similar spectral features. For example bands near 620 cm−1, 730 cm−1, 960 cm−1, 1350 cm−1, 1450 cm−1 and 1580 cm−1 can be identified in the SERS spectra shown in Fig. 1, although the exact band maximum frequency may vary. It should be emphasized that the sample preparation procedure we follow to acquire the displayed bacterial SERS spectra, as well as all previously published bacterial spectra from this lab,8,9,18,21 includes 3 - 5 cycles of washing with millipore water and centrifugation followed by re-suspension in water before the bacterial sample is applied to the SERS substrate (in situ grown Au nanoparticle covered SiO2matrix).
Figure 1.
SERS spectra of five bacterial species including two strains of S. aureus on in situ grown Au nanoparticle cluster covered SiO2chips. The strain and growth media (TSB or NB) are indicated.
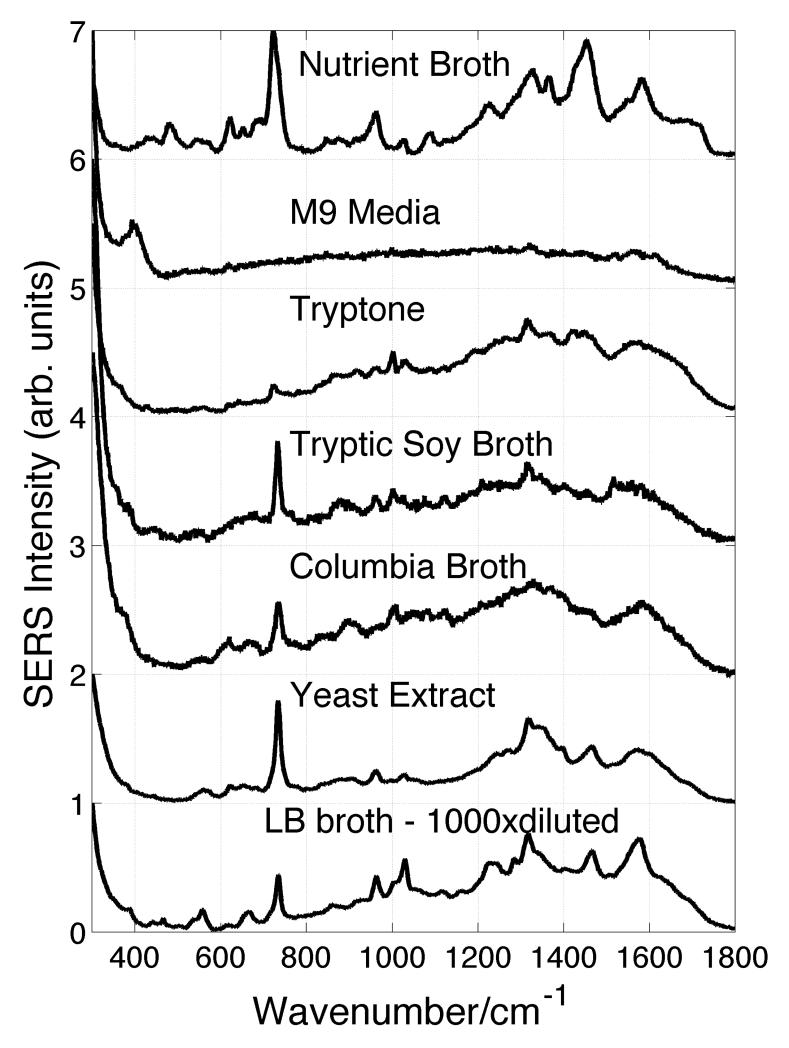
SERS spectra of six different bacterial cell growth media obtained on these same Au nanoparticle covered SiO2substrates are shown in Fig. 2. In addition, the SERS spectrum of one of the key components of Columbia and LB broth, yeast extract, is also displayed in this figure. Comparison of the SERS spectra shown in Figs. 1 and 2 reveal that several of the spectral features seen in the SERS spectra of bacteria are similar to those observed in some of the various growth media. This observation is in agreement with the previous report on the SERS of bacteria and growth media.23 For example, the strong band in the ~730 cm−1 region is evident in the SERS spectra of all the bacterial species as well as appearing in SERS spectra of NB, CB, LB, TSB, and typtone growth media. As indicated above, there is currently little agreement as to the molecular origin of these vibrational bands.
Figure 2.
SERS spectra of bacterial growth media. The ingredients of the media are listed in Table 2. Yeast extract is main component of LB and CB.
Multivariate analysis of bacterial SERS spectra and growth media dependence
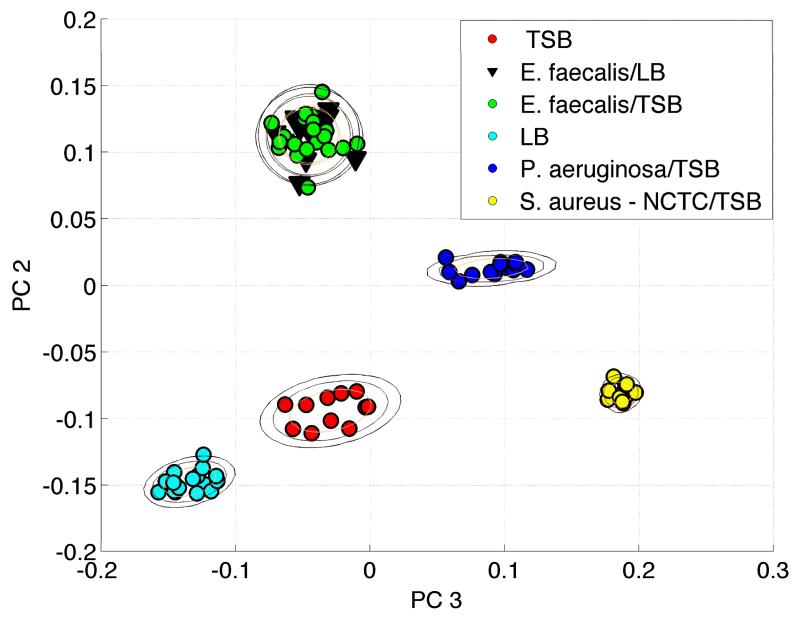
However, despite the similarity between the SERS spectra of some growth media and some vegetative bacterial cells, when SERS spectra of bacteria that have been prepared by repeated washing in water are compared with the growth media that they are grown in clearly distinct and reproducible differences are discerned. We will use a multivariate data analysis approach that has been previously developed for bacterial identification to provide a quantitative measure of degree of similarity/difference for these SERS spectra.18 In Fig. 3 the results of a PCA procedure based on the second derivative barcode approach for SERS spectra of E. faecalis grown in LB and TSB, P. aeruginosa and S. aureus grown in TSB and LB broth, and TSB and LB media alone are shown. Representative spectra for these different samples are given in Figs. 1 and 2. In this 2D PCA contour, PC2 vs. PC3 is plotted because these are the principle components of greatest significance that show the largest differences between distinct groups. Two-dimensional standard deviation rings centered on the mean of each group are also displayed in this figure. In other words, spectra identified by PC2, PC3 values that fall within the smallest contour are within one standard deviation from the mean PC2 and PC3 values for a given resulting cluster. The scond largest ring corresponds to two standard deviations from the mean for the cluster, etc. As evident in the PC2 vs. PC3 plot (Fig. 3), the same organism, E. faecalis, grown in two different media, LB and TSB, cluster together. Furthermore, barcodes based on SERS spectra of three different organisms, P. aeruginosa, S. aureus and E. faecalis grown in the same medium (TSB) form widely separated PCA clusters as seen in Fig. 3. Finally, the PCA clusters corresponding to the SERS of LB, probably the spectrum that most resembles that of bacteria and TSB alone are included in this PCA analysis as well. As seen in Fig. 3, the two growth media and the corresponding E. faecalis grown in these media are far apart on this two-dimensional PCA plot.
Figure 3.
Barcode-based PCA analysis of SERS spectra of E.faecalis grown in LB and TSB, P. aeruginosa and S. aureus grown in TSB and growth media TSB and LB alone. The SERS spectra of E.faecalis grown in LB and TSB are found to be identical.
The PCA clustering evident in Fig. 3 emphatically contradicts the hypothesis23 that the SERS spectra of properly washed bacteria are due to residual growth culture media. The second derivative barcode based PCA used here enhances specificity, thus the media independence for the SERS signature of E. faecalis indicates that whatever the molecular origins of this signal it is not dependent on cell growth media type at least for this species and growth media. The consistently different SERS signatures for the three species grown in the same broth, TSB, similarly argues that what is giving rise to these SERS signals is not directly the media components that the bacteria were cultured in via adsorption to the cell surface or incomplete removal as suggested by Marotta and Bottomley.23 Finally the large and consistent separation between the SERS based clusters of the LB and TSB growth media and the water washedbacteria grown in these same media, make it clear that these are distinct vibrational signatures.
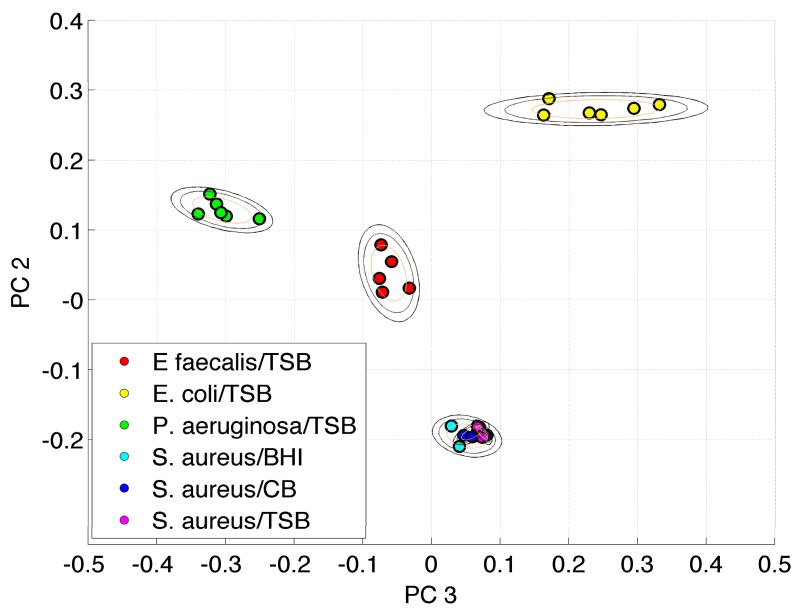
In order to insure that the results in Fig. 3 are not strictly a consequence of the specific bacterium and growth media selected, we carried out an analogous multivariate analysis of the growth media dependence of another bacterium. In Fig. 4, SERS spectra of S. aureus USA300 cultured in three different growth media, TSB, BHI and CB, and three additional bacteria, E. faecalis, E. coli and P. aeruginosa are analyzed together via the barcode PCA treatment. Consistent with the PCA results displayed in Fig. 3, the PCA clusters given by this enhanced specificity approach for S. aureus USA 300 grown in three different media all lie on top of one another in this PCA plot (Fig. 4). In other words, no SERS spectral distinctions can be discerned for this single strain that has been cultured in three different media. However, for the four different bacteria all grown in the same media included in this analysis (Fig. 4), four distinct and widely separated clusters are observed. Figs. 3 and 4 unequivocally argue that the growth media of properly water washed vegetative bacterial cells cannot be attributed to the SERS signatures of the growth media they are grown in despite the close resemblance of some of the media and bacterial SERS spectra.
Figure 4.
Barcode-based PCA analysis of SERS spectra of S. aureus grown in CB, TSB and BHI, P. aeruginosa, E.coli and E. faecalis grown in TSB. The SERS spectra of S. aureus grown in CB, TSB and BHI are found to be identical.
SERS spectra of bacteria grown in minimal media
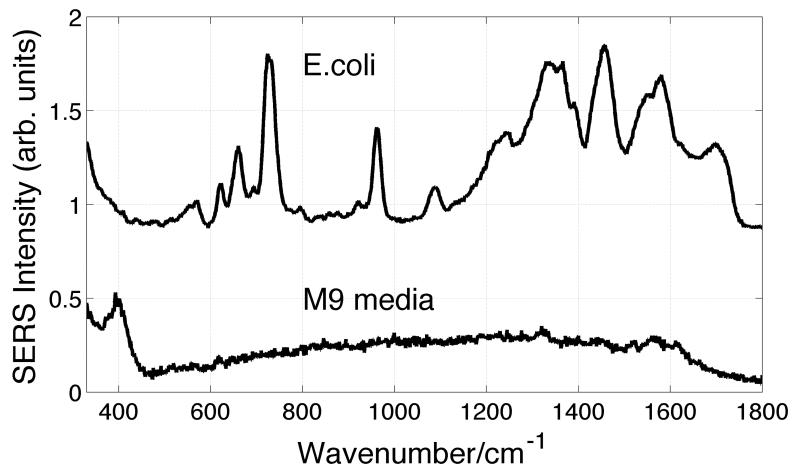
In another attempt to assess the relationship between the SERS spectra of bacteria and culture media, E. coli (11996) were grown in M9 minimal media. As indicated in Table 2, M9 media offers a nearly inorganic diet for bacterial growth. The nitrogen source is NH4Cl and the carbon source is glucose in low concentration. Although bacterial growth is slower in this minimal medium, results for bacteria grown in M9 were of particular interest because its ingredients are so markedly different from the other media employed here which contain far richer mixtures of organic nutrients to support cell growth. One consequence of this simple inorganic mixture is that the corresponding SERS spectrum of the M9 medium is also minimal as seen in Fig. 5. Except for a low frequency band at ~400 cm−1, the SERS spectrum of the M9 medium at the concentration level used to grow bacteria, is virtually devoid of any other vibrational features. In reference to the dilution observations reported by Mariotta and Bottomley,23 further dilution of this aqueous solution only diminishes the observed signal of the weak 400 cm−1 feature. The lack of any strong vibrational signatures in the 500 cm−1 to 1800 cm−1 range is in contrast to the SERS spectra of the more commonly used bacterial growth culture media as evident from comparison with the spectra displayed in Fig. 2. Most notably there is clearly nothing in the ~730 cm−1 region of the M9 SERS spectrum.
Table 2. Summary of bacterial growth media used in this study.
| Growth Media | Main Ingredients | Source |
|---|---|---|
| Difco Columbia Broth (CB) |
Pancreatic digest of casein, yeast extract, proteose peptone, dextrose, sodium chloride, tryptic digest of beef heart, tris (hydroxymethyl) aminomethane HCl, sodium carbonate |
BD Technologies |
| Technologies | ||
| LB Broth (LB) | Typtone, yeast extract, NaCl | Sigma |
| Difco Nutrient Broth (NB) | Peptone, beef extract, yeast extract, sodium chloride |
BD |
| Technologies | ||
| Tryptic soy broth (TSB) | Casein peptone (pancreatic), soya peptone (papainic), NaCl |
Sigma |
| Brain heart infusion (BHI) | Calf brains, beef heart, peptone, dextrose, sodium chloride, disodium phosphate |
BD |
| Technologies | ||
| M9 minimal media (M9) | Na2HPO4-7H2O, KH2PO4, NaCl, NH4O, MgSO4, CaCl2, glucose |
Sigma |
Figure 5.
SERS spectra of M9 minimal media and E. coli (strain 11996) grown in M9 minimal media.
The SERS spectrum of a washed E. coli strain (11996) grown in M9 minimal medium is also shown in Fig. 5. As evident in this figure, characteristic bacterial SERS spectrum (see Fig. 1) is obtained following cell culturing in this medium. For example, the strong feature at ~730 cm−1 is observed in this E. coli SERS spectrum although there is no such band in the M9 medium that it was grown in. The SERS spectrum of this E. coli strain is very similar to that obtained for growth in TSB (Fig. 1), although some small differences are evident for the SERS spectra of this strain grown in these extremely different growth media. Of most direct significance to this study, the molecular species giving rise to the observed bacterial SERS spectrum are not those molecular species found in the growth media. It is unequivocally an inherent biochemical mechanism of these bacterial cells that is giving rise to the molecular species that contribute to the observed SERS bacterial signatures.
Sample preparation procedure analysis
In the prior report suggesting SERS bacterial spectra result from diluted growth media components,23 bacterial samples were prepared without washing and centrifugation cycles, the standard procedure for enriching bacterial cells from their culturing medium. Cell-growth media suspensions were simply diluted by factors of typically 102 prior to SERS data acquisition on the nanostructured (Ag nanorods) substrates used in those studies.23 The bacterial sample preparation procedure followed in our laboratory8,18 and followed by other groups working in this area11,15,17 is quite different than the simple dilution preparation procedure employed by Marotta and Bottomley.23 As summarized above and elsewhere,8,18 we wash and then centrifuge the cultured bacteria 4 - 5 times before we resuspend in water and place this diluted sample on the SERS substrate.
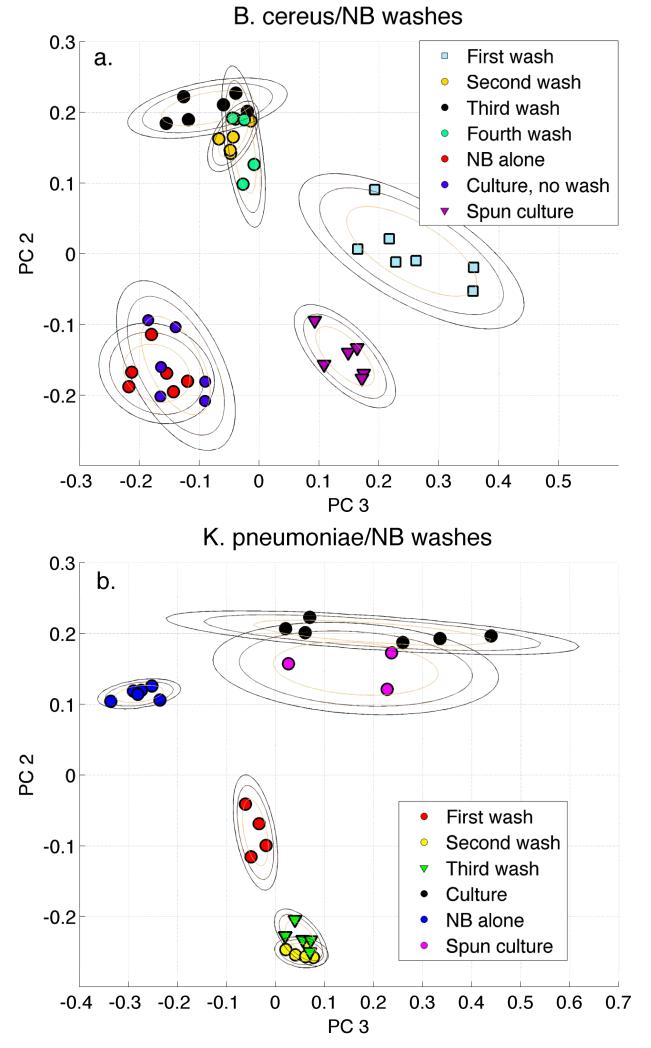
In another attempt to more quantitatively investigate the hypothesis23 that the observed bacterial SERS spectra are dominated by culture media, we performed a multivariate data analysis of the SERS spectra of bacterial suspensions as a function of wash cycle and the growth media alone. The results of a PCA barcode treatment of SERS spectra of diluted NB growth medium, the initial B. cereus culture (NB growth media and bacteria), the re-suspended pellet resulting from the spun or centrifuged initial culture media and the re-suspended pellet following four successive water wash/centrifugation cycles, i.e. our normal sample preparation protocol, are given in Fig. 6a. Several relevant conclusions may be drawn from the PCA analysis represented by the PC2 vs. PC3 results in this figure. First, the SERS based NB and washed bacteria clusters do not overlap and thus are, once again, not identical. The bacterial culture, corresponding to a mix of the bacterial cells, either before or after centrifugation, exhibits some higher order differences relative to the NB media only spectra as evidenced by the same PC2 score but different PC3 values for these sets of spectra. However, of greatest significance for the subject of this study, one can view the evolution of the B. cereus SERS spectral signature as a function of wash cycle from no wash, i.e. in liquid culturing medium, to four cycles. As evident in the PC plot resulting from this barcode multivariate data analysis result significant changes in the SERS spectra are observed from the no wash to the second wash sample. The SERS bacterial spectra however exhibit virtually no change after the second water wash. The B. cereus SERS spectra clusters following water wash 3 or 4 times are essentially overlapping that of the second wash spectra.
Figure 6.
Barcode-based PCA analysis of wash cycles of (a) B. cereus grown in NB and (b) K. pneumonia grown in NB. SERS spectra of NB media alone, the initial liquid culture and the suspended pellet of the spun initial culture are also included in this PCA analysis.
This experiment was repeated with a second bacterial sample, K. pneumoniae cultured in NB broth as well. The corresponding PCA clustering results are given in Fig. 6b. The same trends found for the evolution of the B. cereus SERS spectra as a function of washing cycle are observed for the K. pneumoniae data. The clusters corresponding to the second and third washed bacterial samples overlap and thus indicate no further SERS spectral changes after the second wash cycle. The cluster of SERS spectra of NB medium is well separated from those of the washed K. pneumoniae. The initial culture and re-suspended spun culture pellet are overlapped and again share nearly the same PC2 value as the NB broth alone consistent at least with growth media contributions to the un-washed bacterial culture spectra. With washing the PCA clusters systematically move further away from the NB media only location on this two-dimensional PC contour.
The PCA clustering analysis represented by Figs. 6a and 6b illustrates the following points. (1) The water washing sample preparation procedure is essential for the acquisition of representative reproducible SERS spectra of bacteria in order to remove all vestiges of the culture media. This is usually accomplished after two washing cycles as evidenced in Fig. 6a and 6b. Work from this laboratory is characterized by SERS data acquisition after 3 - 4 water washing cycles,8,9,18,21 (2) This additional multivariate analysis also argues that the bacterial SERS spectra are clearly not due to residual growth media simply adsorbed to the outer layer cell walls or still contaminating the suspension of properly washed bacterial samples placed on the SERS substrates. (3) The robust signature of the SERS spectra of bacteria is seen to systematically emerge from that of the growth medium-whole cell mixture (bacterial culture) with successive cell wash cycles. The data in this figure make it clear how SERS spectra of diluted mixtures of growth media and bacteria could in fact exhibit more similarity to one another when comparing different bacterial species if only water dilution is employed for the sample preparation,23 as compared to employing the standard biochemical protocols of water washing and centrifugation.
Molecular origin of bacterial SERS signals
Two other arguments are offered by Mariotto and Bottomley23 as support for their hypothesis that previously published SERS spectral features of bacteria are predominantly attributable to growth media contamination. Both of these issues are based on the logical, yet unproven, assumption about expectations for the origins of the vibrational bands that constitute the reported SERS of bacteria. It is assumed that these spectra should be dominated by vibrational features associated with the outer bacterial cell wall structure. It is noted that SERS spectra of some Gram-positive and Gram-negative bacteria share several common features and do not appear to have very different spectral signatures23 despite the significant difference in outer cell wall character.24 For example, the SERS spectra of Gram-positive S. aureus and E. faecalis do not exhibit consistently significant differences from the Gram-negative E. coli, K. pneumonia and P. aeruginosa as seen in Fig. 1. In particular, the band at ~730 cm−1 is the most intense vibrational transition observed in all of the bacterial SERS spectra shown in Fig. 1. Since the outer cell wall structure is different for Gram-positive and Gram-negative bacteria and yet the observed SERS spectra are similar, the argument is made that the published SERS spectra could result from cell growth media. However, other possibilities exist for the molecular origins of these signals that may not be strictly correlated with the cell wall structural differences. For example, these SERS signals may arise from other molecules that are involved with the cell activities such as cell signaling or cell metabolism, which can offer chemical signatures not directly correlated with outer cell wall structure, but still offer species/strain specificity. Cell lysis may also contribute to these signals although this seems less likely given the signal intensity is largest when Raman excitation is focused on the intact cells and the signal intensity does not change with time in DI water or with additional centrifugation cycles.
A second additional argument offered in this earlier work,23 was that the SERS spectrum appeared continuously distributed across the SERS substrate, albeit with different intensities, as compared to being just localized at random but concentrated regions where bacterial cells were located. However, again depending the nature of these bacterial signals, e.g. if they were due to metabolites or signaling molecules they could be present in the sample cell suspension. Furthermore, if these signals were due to the cell growth media from the diluted cell-growth media suspension sample preparation, then of course these signals, which can resemble bacterial SERS signals (see Figs. 1 and 2), will be observed over the SERS substrate surface and not just near the local concentrations of aggregated bacterial cells evident in SEM images.
Conclusion
The purpose of this paper is to investigate and evaluate the hypothesis offered by Marotta and Bottomley23 that previous reported SERS spectra of bacteria were due to cell growth media that had not been completely removed from cultured bacterial cell samples that were placed on the SERS substrates. This hypothesis was based on: (1) the resemblance between the SERS spectra of bacteria and of several cell growth media, (2) the appearance of a SERS spectrum of the media upon dilution, (3) the similarity between SERS spectra of Gram-positive and Gram-negative bacterial species, and (4) the spatial distributions of the bacteria like spectrum on the SERS substrate. However, the multivariate data analysis of the SERS spectra of bacteria prepared by the standard multiple washing/centrifugation protocol show that; different bacterial species grown in the same media exhibit different SERS spectra, the same bacterial species grown in different media show the same SERS spectra and finally, SERS spectra of bacteria and the culture media they are grown in are reproducibly distinct. The comparison of the M9 minimal media and the E. coli strain cultured in M9 SERS spectra are an extreme example of this difference between the inherent SERS signature of (washed) bacterial cells and that of the cell growth medium.
The apparent similarity in appearance between the bacterial cell and growth media SERS spectra undoubtedly reflects the fact that there are several components or molecules structurally similar to some components of these cell growth media that also contribute to the SERS spectra of washed bacterial cells. This appears to be particularly true for media containing extracts from other microorganisms such as yeast extract, as seen in Fig. 1. The molecular origins of these bacterial SERS signals more specifically will be the subject of a subsequent paper from this laboratory.
The appearance of a SERS spectrum of some media upon water dilution, as reported in Marotta and Bottomley, is probably just due to the optical or physical thickness of the non-diluted medium sample. This interpretation is supported by the reported SERS spectrum of un-diluted growth media which is not a SERS spectrum since a large fluorescence background is observed.23 Spontaneous fluorescence is effectively quenched when SERS can be observed due to the efficient energy transfer to the metal when the analyte is close to the metal surface.8 As discussed above, the expected significant differences between SERS spectra of Gram-positive and Gram-negative bacteria and the spatial distribution of the SERS bacterial signal itself on the SERS substrate presumes that the bacterial SERS signals predominantly arise from outer cell structural components which may not be accurate. Furthermore, as shown here, removal of cell growth culture media can be accomplished by following standard water washing/centrifugation cycles (~3). If the bacterial cells are simply diluted in water, the observed SERS spectrum may indeed be contaminated by residual growth media (Fig. 6). In conclusion, the results of this study argue that the previously reported bacterial SERS signals do not arise from residual growth media, as suggested by Marotta and Bottomley,23 and the use of ERS to achieve rapid, portable, bacterial diagnostics via SERS remains a possibility as long as proper protocols are used to prepare these vegetative cells.
Acknowledgement
The support of the National Institute of Health (Grant # 1R01AI090815-01) and BD Technologies, Research Triangle Park, NC are gratefully acknowledged. We thank Dr. Jean Lee, Harvard Medical School, Boston MA, for helpful discussions about M9 minimal media, Dr. Don Moyer at Microbiotix, Inc., Worcester MA, and Dr. Kristin Weidemaier at BD Technologies, Research Triangle Park, NC for supplying some of the bacterial strains used here.
References
- 1.Efrima S, Bronk BV, Czege J. Proceed SPIE. 1999;3602:164–71. [Google Scholar]
- 2.Zeiri L, Bronk BV, Shabtai Y, Czege J, Efrima S. Colloid Surf A. 2002;208:357. [Google Scholar]
- 3.Guzelian AA, Sylvia JM, Janni J, Clauson SL, Spenser KM. Proceed SPIE. 2002;4577:182–92. [Google Scholar]
- 4.Fell NF, Jr., Smith AGB, Vellone M, Fountain AW., III Proceed SPIE. 2002;4577:174–81. [Google Scholar]
- 5.Jarvis RM, Brooker A, Goodacre R. Anal Chem. 2004;76:5198–202. doi: 10.1021/ac049663f. [DOI] [PubMed] [Google Scholar]
- 6.Jarvis RM, Goodacre R. Anal Chem. 2004;76:40–7. doi: 10.1021/ac034689c. [DOI] [PubMed] [Google Scholar]
- 7.Jarvis RM, Brooker A, Goodacre R. Faraday Discuss. 2006;132:281–92. doi: 10.1039/b506413a. discussion 309-19. [DOI] [PubMed] [Google Scholar]
- 8.Premasiri WR, Moir DT, Klempner MS, Krieger N, Jones G, II, Ziegler LD. J. Phys. Chem. B. 2005;109:312–20. doi: 10.1021/jp040442n. [DOI] [PubMed] [Google Scholar]
- 9.Premasiri WR, Moir DT, Klempner MS, Ziegler LD. In: New Approaches in Biomedical Spectroscopy. Kneipp K, Aroca R, Kneipp H, Wentrup-Byrne E, editors. Oxford University Press; New York: 2007. p. 164. [Google Scholar]
- 10.Sengupta A, Laucks ML, Davis EJ. Appl Spectrosc. 2005;59:1016–23. doi: 10.1366/0003702054615124. [DOI] [PubMed] [Google Scholar]
- 11.Kahraman M, Yazici MM, Sahin F, Bayrak OF, Culha M. Appl Spectrosc. 2007;61:479–85. doi: 10.1366/000370207780807731. [DOI] [PubMed] [Google Scholar]
- 12.Kahraman M, Yazici MM, Sahin F, Culha M. Langmuir. 2008 doi: 10.1021/la702240q. [DOI] [PubMed] [Google Scholar]
- 13.Culha M, Kahraman M, Cam D, Sayin I, Keseroglu K. Surf. and Interface Anal. 2010;42:462–65. [Google Scholar]
- 14.Chu H, Huang Y, Zhao Y. Silver nanorod arrays as a surface-enhanced Raman scattering substrate for foodborne pathogenic bacteria detection. Appl. Spectrosc. 2008;62:922–31. doi: 10.1366/000370208785284330. [DOI] [PubMed] [Google Scholar]
- 15.Liu T-T, Lin Y-H, Hung C-H, Liu T-J, Chen Y, Huang Y-C, Tsai T-H, Wang H-H, Wang D-W, Wang J-K, Wang Y-L, Lin C-H. PLoS ONE. 2009;4:e5470. doi: 10.1371/journal.pone.0005470. [DOI] [PMC free article] [PubMed] [Google Scholar]
- 16.Zeiri L, Efrima S. J Raman Spectrosc. 2005;36:667–75. [Google Scholar]
- 17.Zeiri L, Bronk BV, Shabtai Y, Eichler J, Efrima S. Appl. Spectrosc. 2004;58:33–40. doi: 10.1366/000370204322729441. [DOI] [PubMed] [Google Scholar]
- 18.Patel IS, Premasiri WR, Moir DT, Ziegler LD. J Raman Spectrosc. 2008;39:1660–72. doi: 10.1002/jrs.2064. [DOI] [PMC free article] [PubMed] [Google Scholar]
- 19.Guicheteau J, Christesen SD. SPIE. 2006;6218:62180G–1. [Google Scholar]
- 20.Liu Y, Chen Y-R, Nou X, Chao K. Appl. Spectrosc. 2007;61:824–31. doi: 10.1366/000370207781540060. [DOI] [PubMed] [Google Scholar]
- 21.Premasiri WR, Moir DT, Ziegler LD. Proceed SPIE. 2005;5795:19–29. [Google Scholar]
- 22.Guicheteau J, Christesen SD, Emge D, Tripathi A. J. Raman Spectrosc. 2010 [Google Scholar]
- 23.Marotta NE, Bottomley LA. Appl. Spectrosc. 2010;64:601–06. doi: 10.1366/000370210791414326. [DOI] [PubMed] [Google Scholar]
- 24.Lengeler JW, Drew G, Schlegel HG. Biology of the Prokaryotes, Blackwell Science, Thieme. 1999 [Google Scholar]


