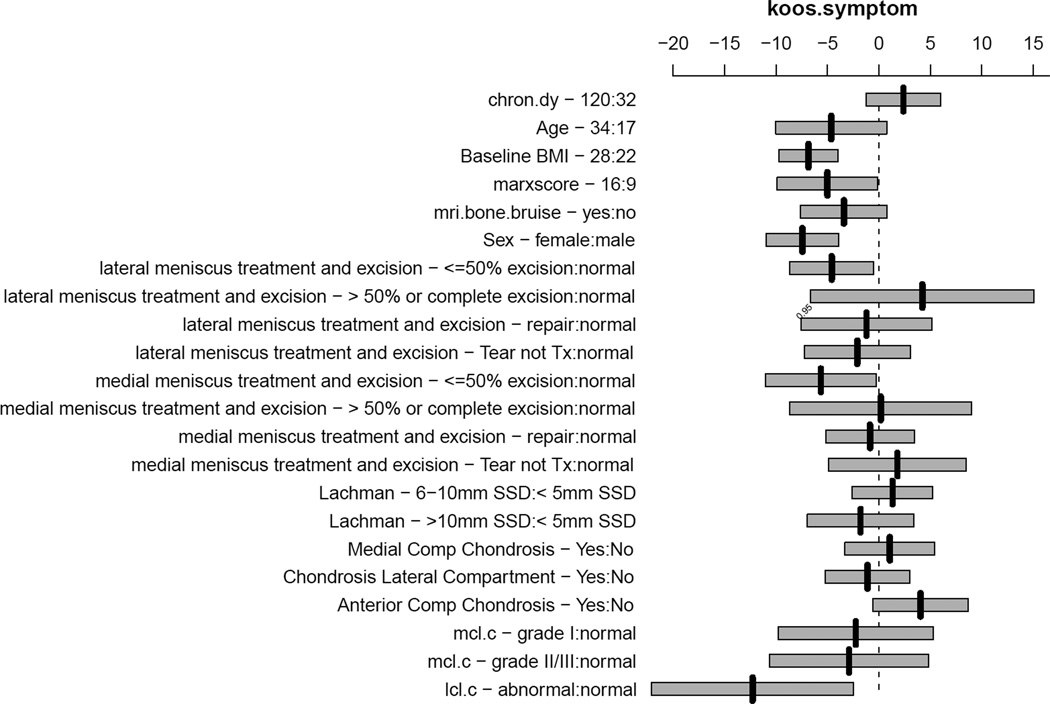
Figure 4.
Plot of effects of predictors in the model for KOOS symptoms subscale using interquartile ranges for continuous variables with bars representing the 95% confidence interval for the mean effect. For example, the effect of raising BMI from its first quartile (22) to its third quartile (28) is to lower the mean KOOS symptoms score by 7 points. For the KOOS symptoms subscale a score of 100 indicates normal without symptoms and a score of zero indicates the worst symptoms. Thus, lowering the KOOS symptom score indicates an increase in symptoms. Abbreviations is order presented: chron.dy = chronicity in days, bmi = body mass index, Itx.ex - <−50% = lateral meniscus tear less than or equal to 50% excision, Itx.ex - > 50% or complete = lateral meniscus tear great than 50% or complete excision, Itx.ex – tear not tx = lateral meniscus tear not treated, mtx = medial meniscus tear, lach.ssd.c – 6–10mm = Lachman physical examination 6–10mm vs. less than 5mm side-to-side difference, lach.ssd.c - >10mm SSD = Lachman physical examination greater than 10mm side-to-side difference, mcl.c = medial collateral ligament, lcl.c = lateral collateral ligament.

