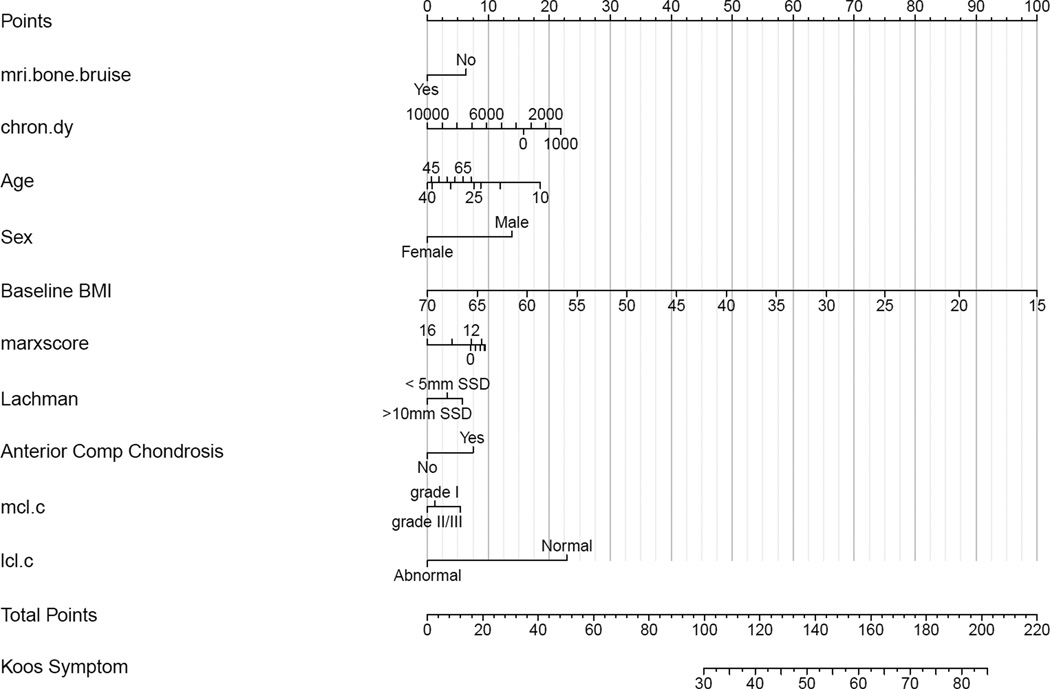
Figure 5.
Nomogram for model predicting KOOS symptoms score. The nomogram is used to predict an individual patient’s KOOS score as follows. First, each variable is marked and the points for each are derived by viewing the point total on the top of the nomogram. Then the points are totaled and placed on the bottom total points scale. After placing the total points, view down to obtain KOOS subscale score.

