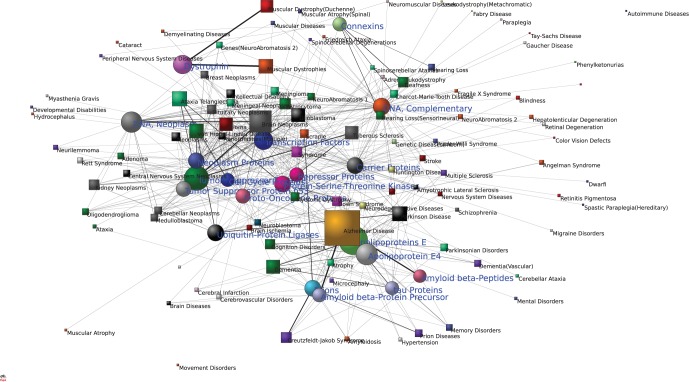
Figure 2. Major molecular substances, associated diseases and their interrelationships.
Circular nodes denote molecular substances, square nodes denote diseases. Several high density “node groups” are present in the integrated network. Nodes in the network periphery indicate that they with loose connected to other nodes in the network. The color of a square node indicates the number of circular nodes that this square node links to sufficiently.

