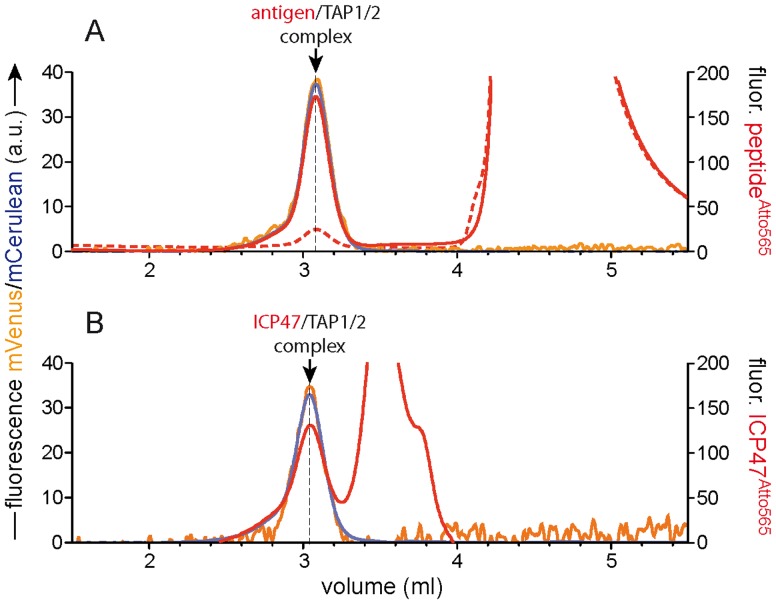
Figure 6. Multicolour FSEC for analysis of larger complexes.
(A) Assembly of an antigen/TAP1/TAP2 complex. An antigenic epitope labelled with Atto565 was incubated with purified TAP alone (solid red trace) or with a 100-fold excess of unlabelled peptide before analysis (dashed red trace). The orange line represents TAP1-mVenus subunit, cyan TAP2-mCerulean, and red the Atto565 labelled antigenic epitope. (B) Assembly of an ICP47/TAP1/TAP2 inhibitory complex. The red trace indicates the specific binding of ICP47 labelled with Atto565 (generated by subtraction of traces with a 100-fold excess of unlabelled ICP47). The TAP1-mVenus signal in these experiments shows a high level of noise due to the suboptimal excitation and emission wavelengths used (see Materials and Methods).

