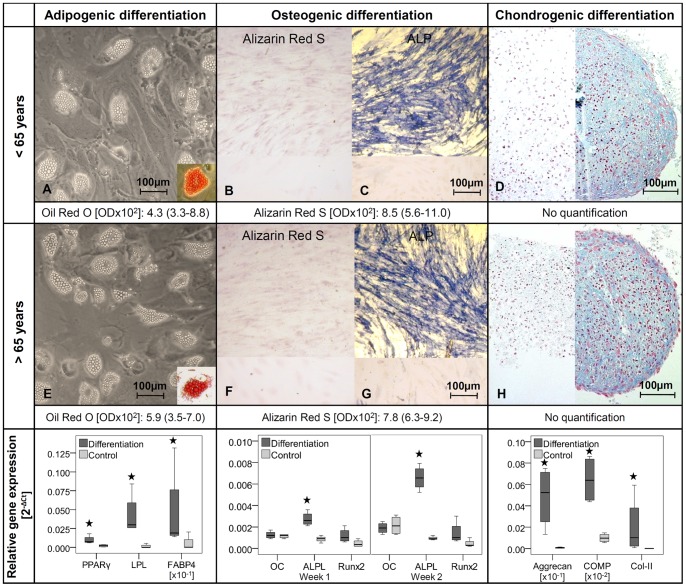
Figure 4. Multipotent differentiation potential of female TLCs.
Representative images of multipotent differentiation of TLCs of female donors younger (A–D) and older (E–H) than 65 years. A and E Adipogenic differentiated cells showed lipid vacuoles, which were stained red after Oil Red O staining (cut-out). B and F Alizarin Red S staining after osteogenic differentiation was relatively weak in TLCs compared to the undifferentiated control cells (bottom). C and G ALP staining revealed a strong blue color in osteogenic differentiated TLCs compared to undifferentiated cells (bottom) D and H Blue stained chondrogenic differentiated cell pellets after Alcian Blue staining (right) versus control cell pellets (left). Relative gene expression of lineage specific markers was upregulated in the differentiated cells compared to undifferentiated control cells (p = 0.029).

