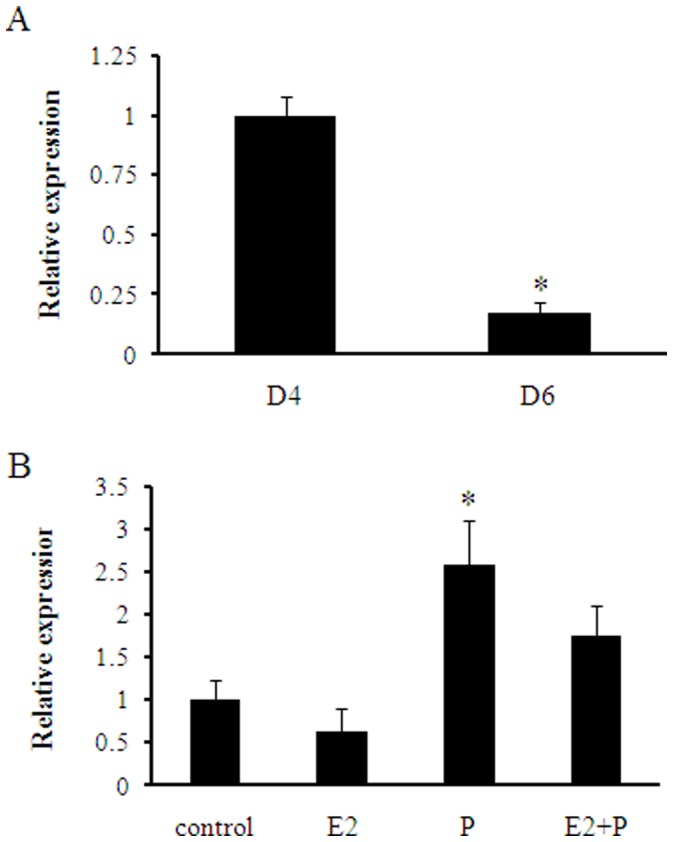
Figure 1. Real-time PCR analysis of mmu-miR-141 expression.

The mmu-miR-141 expression level was significantly lower in D6 than in D4 (A). mmu-miR-141 expression in progesterone treated group was the most higher than the other groups (B). *P<0.05.

The mmu-miR-141 expression level was significantly lower in D6 than in D4 (A). mmu-miR-141 expression in progesterone treated group was the most higher than the other groups (B). *P<0.05.