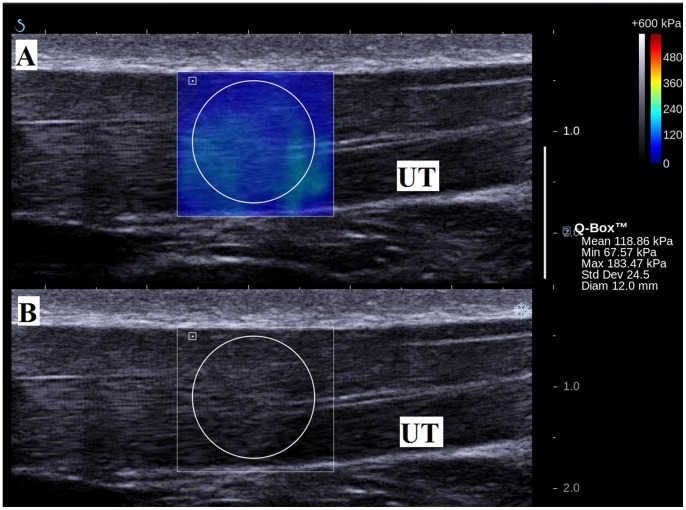
Figure 5. Measurement of elasticity of the upper trapezius muscle (UT) in longitudinal view with arm at 30° abduction.
(A) Color-coded box presentations of the UT elasticity (stiffer areas were coded in red and softer areas in blue) superimposed on a longitudinal grey scale sonogram of the UT, with the circle representing the region of interest (ROI), and were adjusted according to the thickness of the muscle. The shear elastic modulus of the ROI is shown in the Q-box™ on the image. (B) Longitudinal grey scale sonograms of UT on the identical scan planes.

