
Figure 3. Hypoactivation for dyslexia in sensory regions.
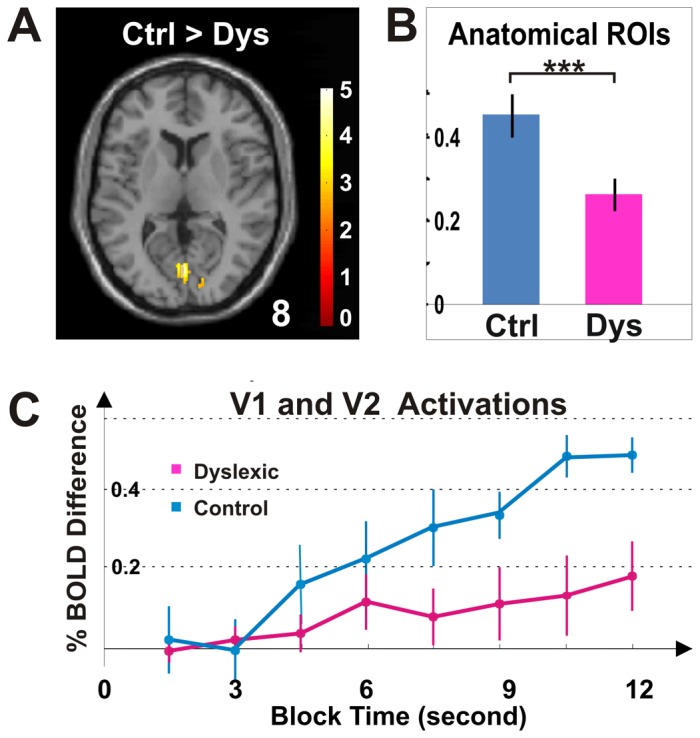
(A) The brain image illustrates occipital voxels that exhibited significantly greater activation for the control group than for the dyslexic group (Control>Dyslexic, p<0.05, cluster corrected for occipital lobe, shown at 8 mm above the AC-PC level). The difference in group activations was most evident at the posterior occipital lobe, around visual areas V1 and V2. (B) Occipital activation for the control group was significantly greater than for the dyslexic group. (C) The activation time course for anatomically determined visual areas in V1 and V2 shows greater occipital activation for the control group than for the dyslexic group. *** p<10−6; main effect of group in two-way ANOVA for participant group and visual areas. Error bars indicate SEM within group.