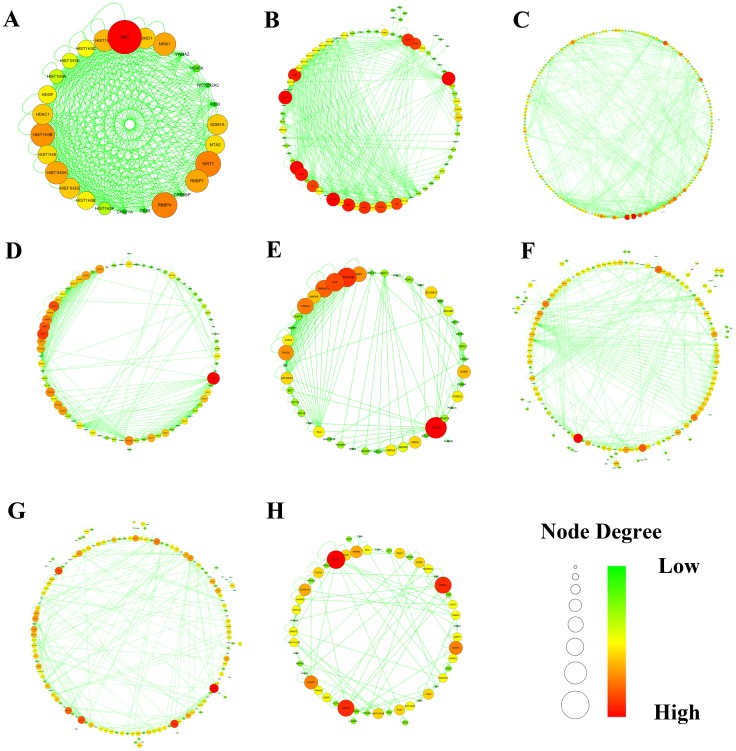
Figure 3. Signaling regulatory modules of human cancer signaling network generated by AllegroMCODE based on molecular complex detection (MCODE) algorithm.
A-H represented signaling regulatory networks 1–8. Circle dots in the networks corresponded to genes. Red represented high degree connectivity, whereas green stood for low degree connectivity.

