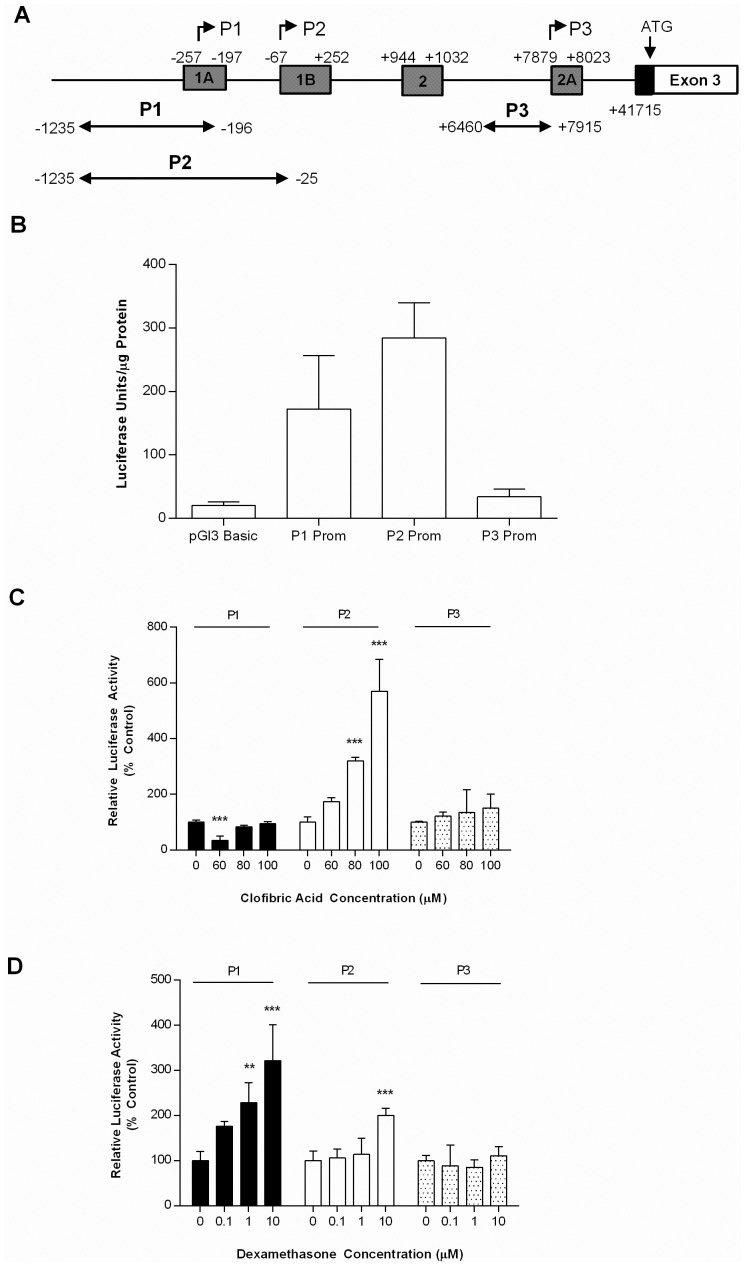
Figure 2. P1 and P2 promoters are active in HepG2 cells.
A) Schematic diagram showing the relative locations of PPARα P1, P2 and P3 cloned promoter regions and their positioning relative to Ensembl transcription start site and 5′UTR exons. B) PPARα P1, P2 and P3 promoter constructs (P1, P2 and P3 Prom 1 µg) and an empty control vector (pGL3Basic 1 µg) were transfected into HepG2 cells and promoter activity assessed 24 hrs later. C and D) Regulation of PPARα promoter activity by clofibric acid and dexamethasone. P2 and P3 promoter constructs were transfected into HepG2 cells and treated for 24 hrs with vehicle control or an increasing concentration of dexamethasone (0, 0.1, 1 or 10 µM) or clofibric acid (60, 80, 100 µM). All values represent the mean of 6 independent experiments ±SEM.). Statistical comparisons of luciferase activity between treatments relative to the untreated control were determined by ANOVA followed by Bonferroni post hoc analysis. (* p<0.05, ** p<0.001, *** p<0.001).

