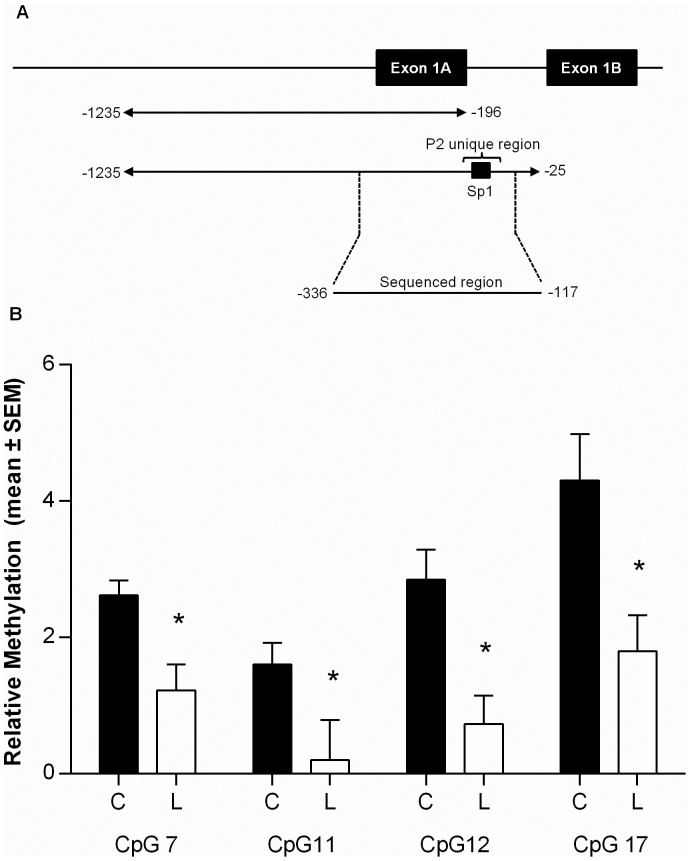
Figure 5. Pyrosequencing analysis of the PPARα promoter in adipose tissue of saline or leptin treated adult female rats.
A) Schematic diagram showing the location of the CpGs sequenced. All exon positions are indicated relative to the Ensembl transcription start site B) Pyrosequencing analysis of CpGs within the PPARα promoter. Values represent mean methylation levels ±SEM (n = 8/group).Only CpG sites where a significant difference in methylation between the saline and leptin treated groups are shown. Saline treated, black bars (C), leptin treated white bars (L). Significant differences in DNA methylation between saline and leptin treated groups was determined using a Students unpaired t-test where *p<0.05.

