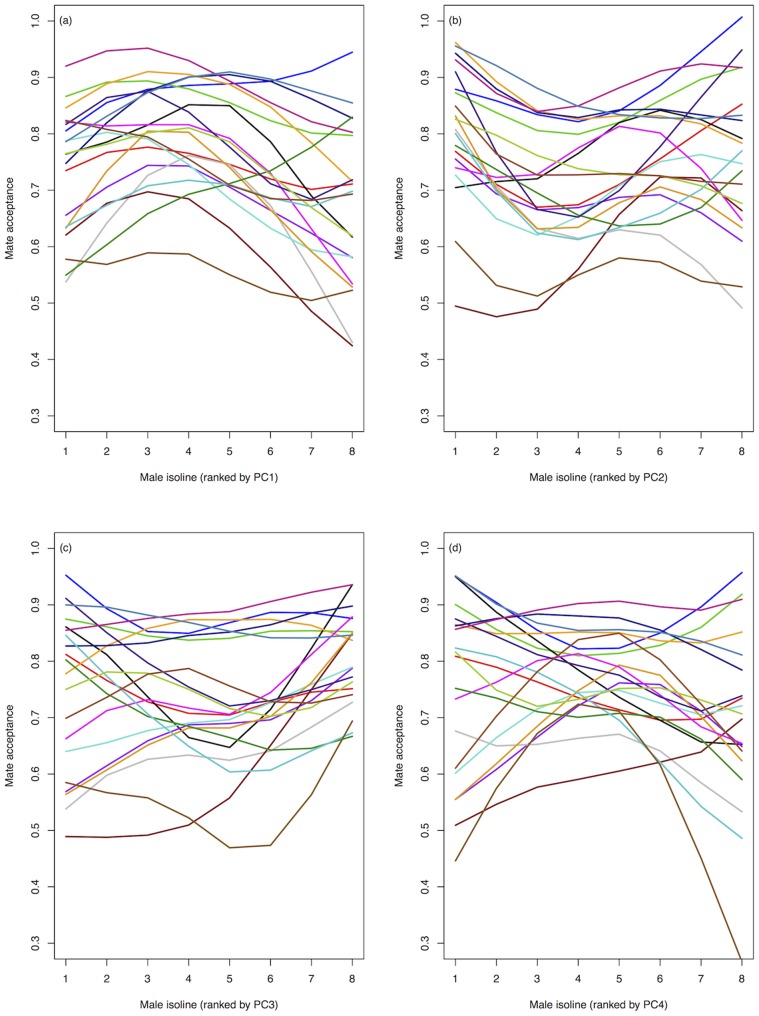
Figure 4. Genetic variation in female preference (mate acceptance) as a function of male CHC profile (PCs 1–4, (a)–(d)).
Male isolines (N = 8 isolines) are ranked on the x-axis according to mean PC score (left (low) to right (high) along axis). Each coloured line represents a female genotype (N = 20 isolines) pooled across temperatures.

