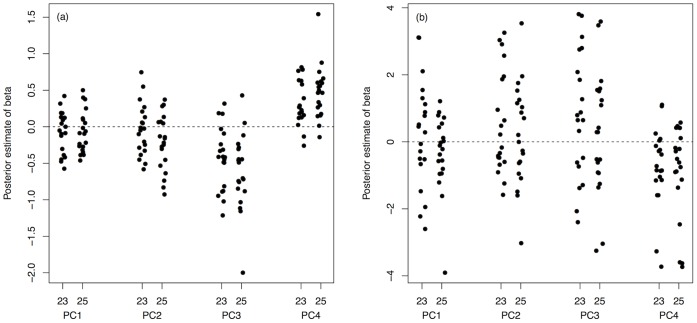
Figure 5. Posterior estimates of beta, β, the linear selection gradient, on each PC of male CHC expression for each female isoline×temperature combination using (a) female choosiness (copulation latency) and (b) female preference (mate acceptance) data.
Each point represents a female isoline and the dashed line denotes β = 0 (i.e. no linear selection). Linear selection was significant overall on PC3 and PC4 for both choosiness and preference, and also on PC2 for choosiness (see text for details).

