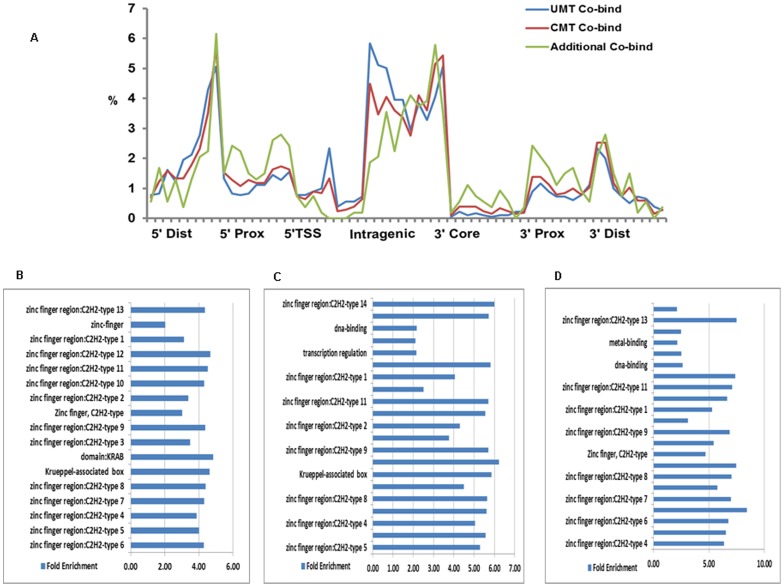
Figure 4. Genomic sites bound KAP1, SETDB1 and H3K9me3 identified in the UMT and CMT peaks sets.
A. Location analysis showing the same trends of binding site distribution for all three co-bound sites using 2035 UMT, 2305 CMT and 682 additional peaks. B–D. GO analyses identified 757 genes in the common CMT peak set (B); 1047 genes in the common UMT peak set (C) and 274 genes in the additional 682 peak set (D); Zinc Finger C2H2-type genes are enriched in all three peak sets.

