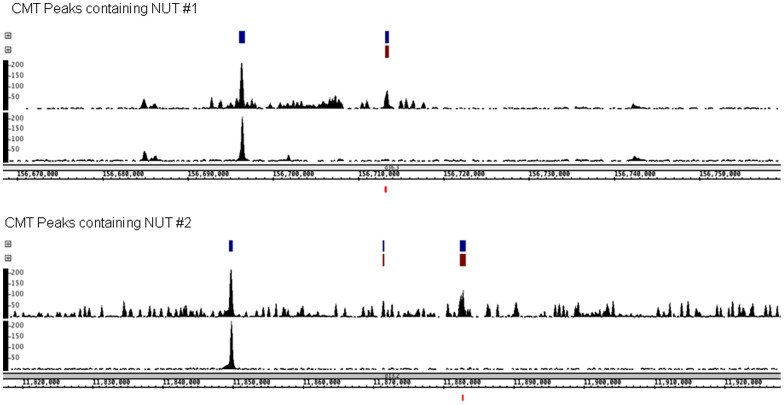
Figure 5. Screenshots of NUT regions tested by ChIP-PCR.
The Integrated Genome Browser (http://bioviz.org/igb/) was used to visualize TCF7L2 ChIP-seq data in HCT116. The snapshots show called peaks for the CMT dataset (blue) and NUT peaks (red) above the raw read visualization tracks. In each panel, the top visualization track contains CMT tags and includes NUTs. The bottom visualization track contains only UMTs. Below the genomic coordinates for each snapshot, the small red box indicates the region for which PCR primers list in Figure S3 in File S1.

