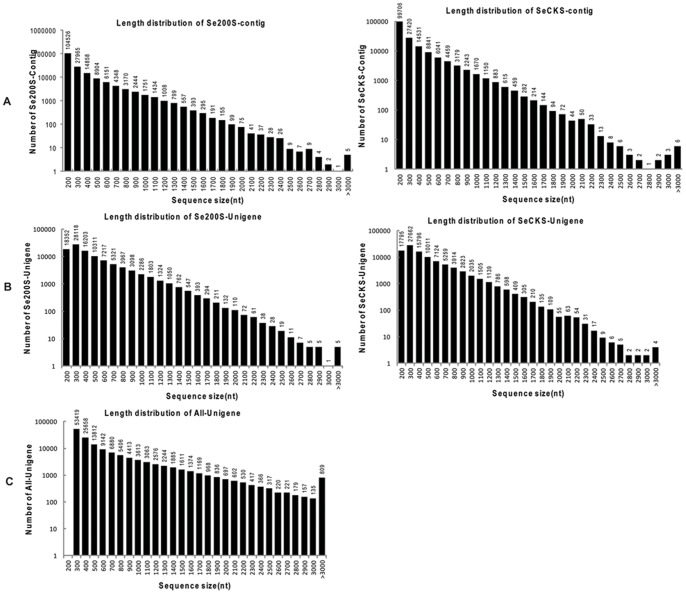
Figure 1. Size distribution of the contigs and unigenes generated byde novo assembly.
(A) Size distribution of contigs. The x-axis represents contig size, and the y-axis represents numbers of contigs of a certain length. (B) Size distribution of unigenes. The x-axis represents unigene size, and the y-axis represents the number of unigenes with a certain length. (C) Size distribution of All-Unigenes. The x-axis represents All-Unigenes size, and the y-axis represents the number of All-Unigenes with a certain length.

