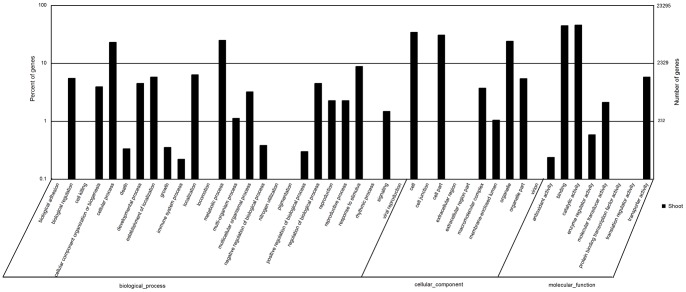
Figure 3. Histogram presentation of GO classification.
A total of 35,268 (32.15%), 43,713 (39.84%) and 21,334 (19.45%) unigenes of S. europaea were classified into 44 terms from three ontologies involved in biological processes, cellular components and molecular function, respectively. The right y axis indicates the number of genes in a category. The left y axis indicates the percentage of a specific category of genes in the main category.

