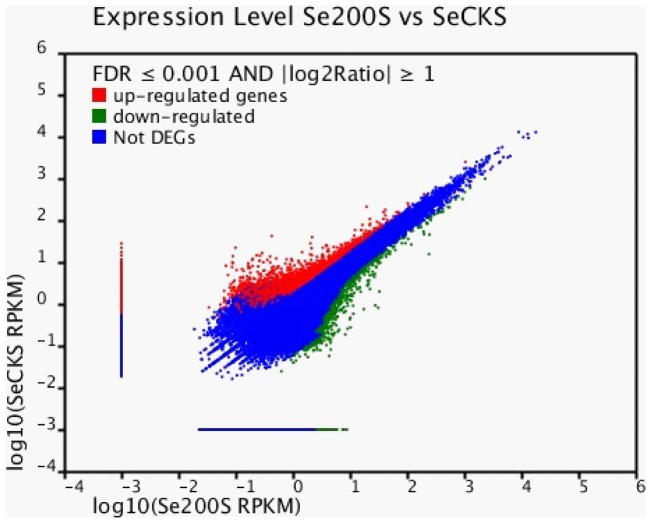
Figure 4. Se200S-vs-SeCKS differentially expressed genes.
DEGs were filtered using FDR ≤0.001 and Log2Ratio ≤1 as a threshold. Red spots represent upregulated genes, and green spots indicate downregulated genes. Blue represents those genes that did not show obvious changes between the Se200S and SeCKS samples.

