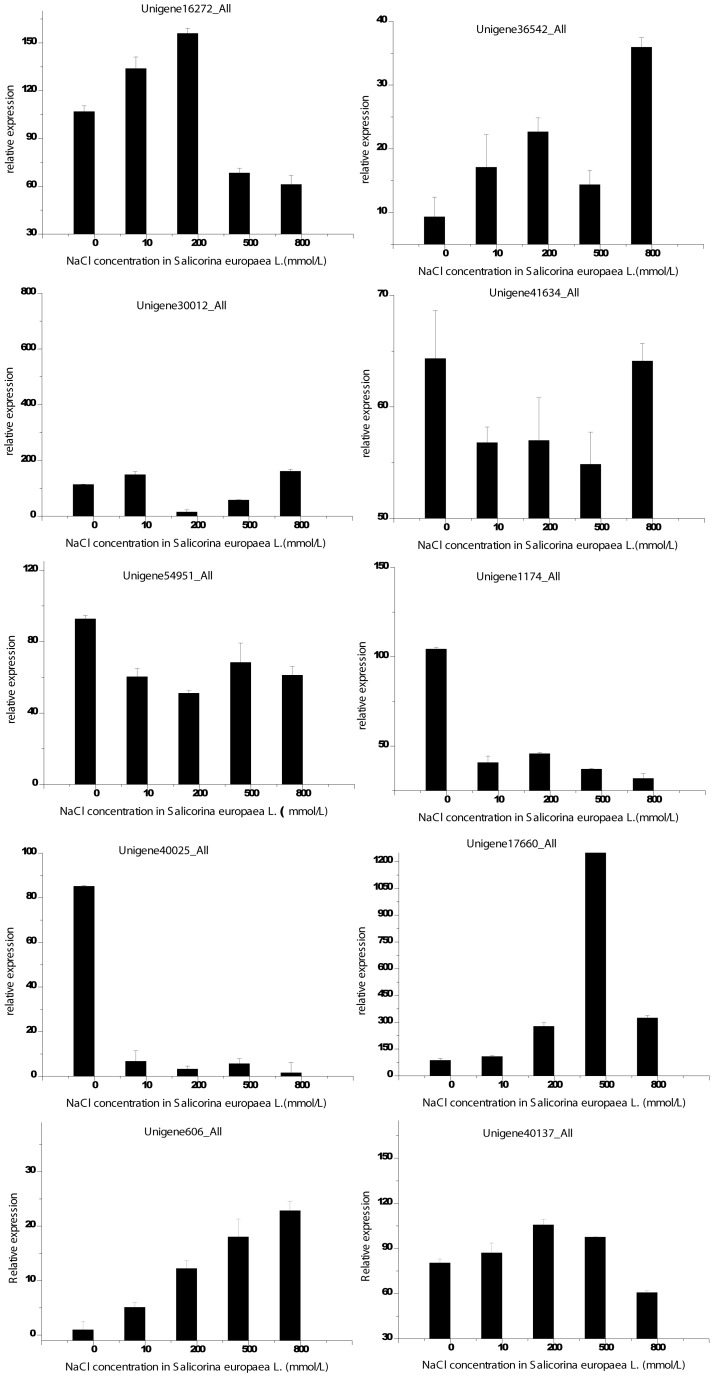
Figure 5. Validation of Transcriptome Profiling expression with QRT-PCR.
The transcript abundance from Transcriptome Profiling data is shown above each gene. Relative transcript levels are calculated by real-time PCR using alpha-tubulin as the standard. Three biological replicates were performed, and the data shown are typical results.

