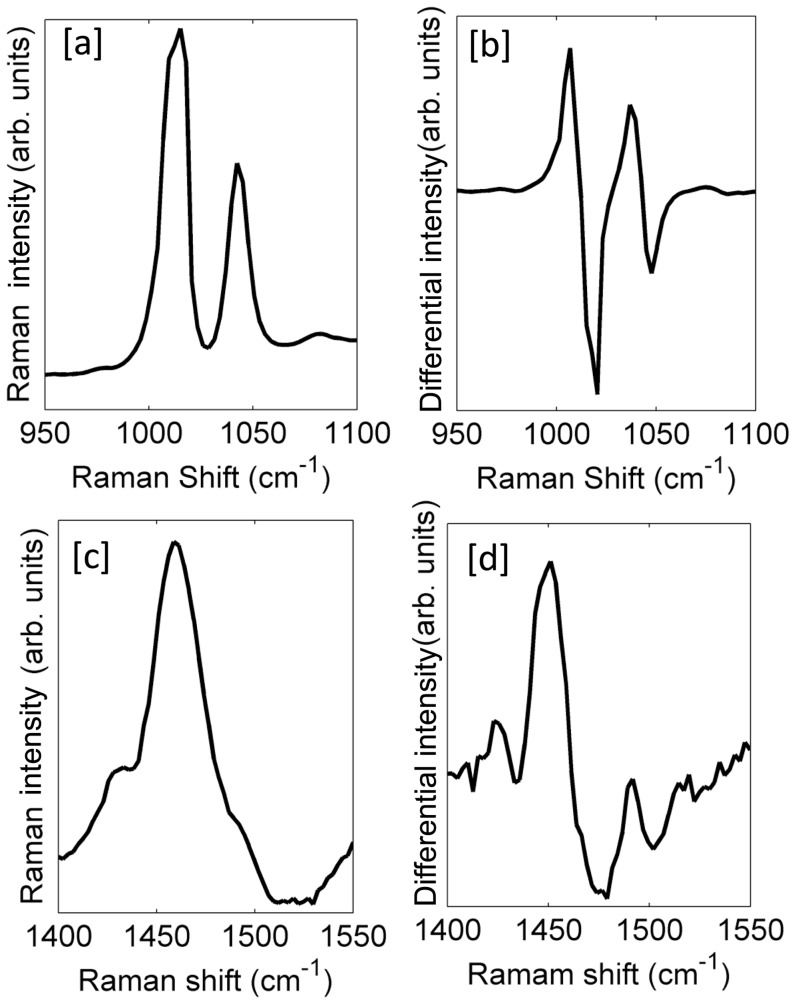
Figure 1. Illustration of the prominent peaks of polystyrene beads and bladder cancer cells (MGH-U1).
[a] Standard Raman spectrum of the 1001.4 cm−1 peak of polystyrene [b] Wavelength Modulated (WM) Raman spectrum of the 1001.4 cm−1 peak of polystyrene [c] Standard Raman spectrum of the 1453 cm−1 peak of MGH-U1 [d] WM Raman spectrum of the 1453 cm−1 peak of MGH-U1.

