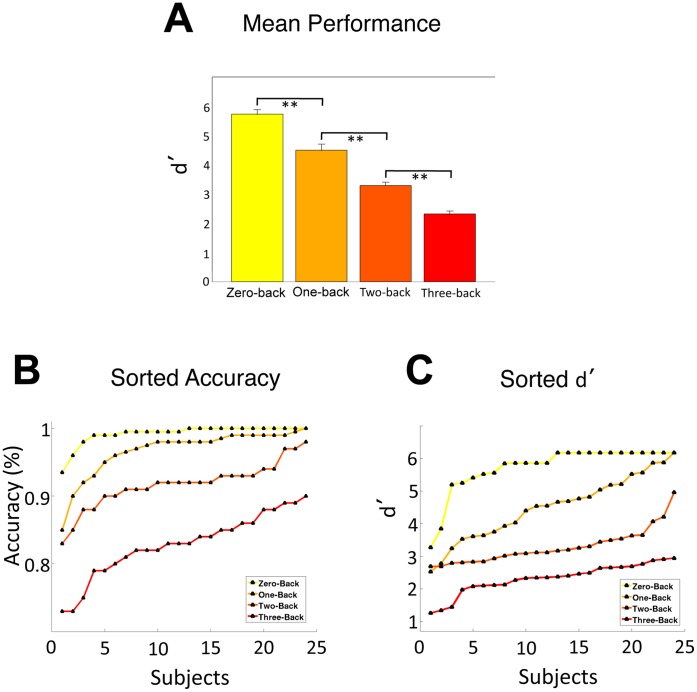
Figure 2.
A: Mean Performance (± standard error). Performance significantly decreased with increasing task difficulty. B: Individual subject accuracy for each n-back condition. The three-back condition has a more linear distribution than the other two conditions and no ceiling effect (linear regression fit: zero-back r2 = 0.46; one-back r2 = 0.66; two-back r2 = 0.85; three-back r2 = 0.93). C: Individual subject d′ for each n-back condition. (linear regression fit: zero-back r2 = 0.58; one-back r2 = 0.98; two-back r2 = 0.81; three-back r2 = 0.89) ** = p<0.01, Bonferroni corrected.

