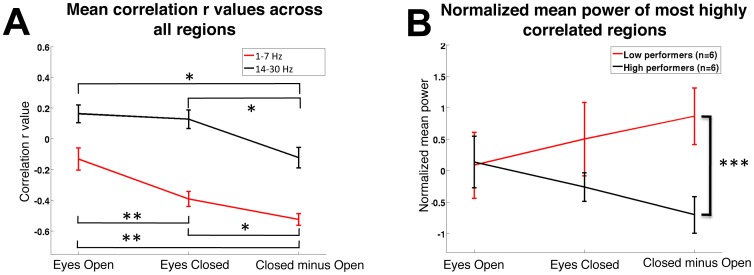
Figure 5.
A: r values for all regions across conditions show a larger inverse correlation and a decrease in positive correlation in the zECO conditions. B: Using the most highly correlated normalized band and region comparisons (delta/theta right posterior frontal, delta/theta right parietal, beta right posterior frontal), high performers and low performers exhibit large differences in the zECO power across resting-state conditions. * = Bonferroni corrected p<0.05. ** = Bonferroni corrected p<0.01. *** = single comparison p<0.001.

