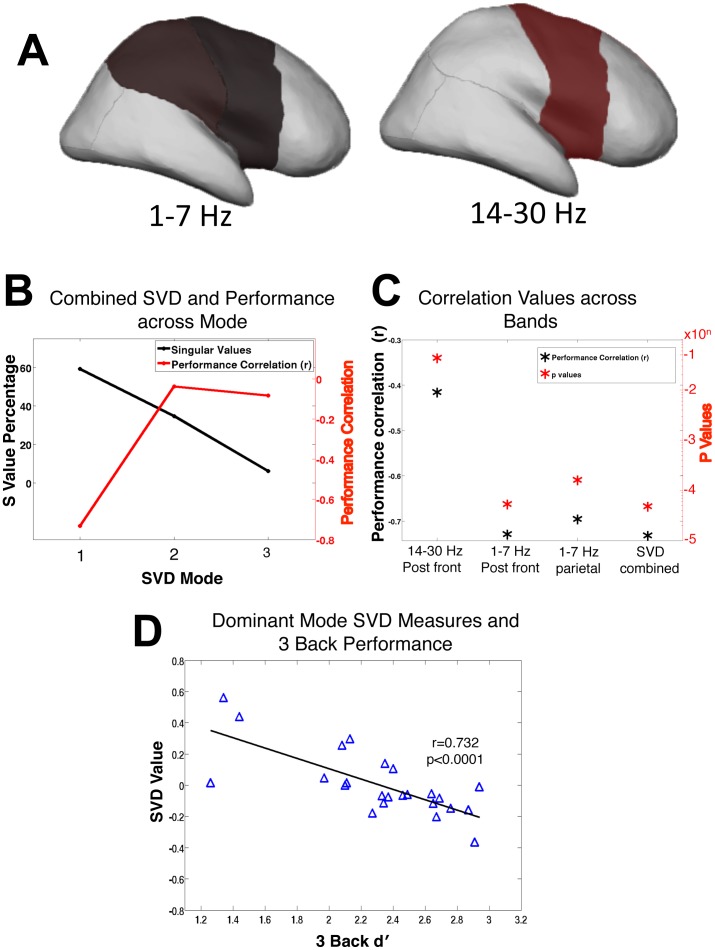
Figure 6. SVD combined regions and association with working memory performance.
A: Representative diagram of the delta/theta and beta regions used in the SVD (delta/theta right posterior frontal, delta/theta right parietal, beta right posterior frontal regions). B: The singular values for the SVD matrix indicated that 59% of the variability in the data was present in the first mode, and that this mode correlated with WM performance. The second and third modes contained 35% and 6% of the variability respectively, but these modes did not correlate with performance. C: Displays individual Pearson’s correlation values (r) and significance values (p) for selected region comparisons as well as the calculated dominant (first) mode SVD r and p values. D: Scatter plot showing a strong association between the SVD values of the first mode and three-back d′scores.

