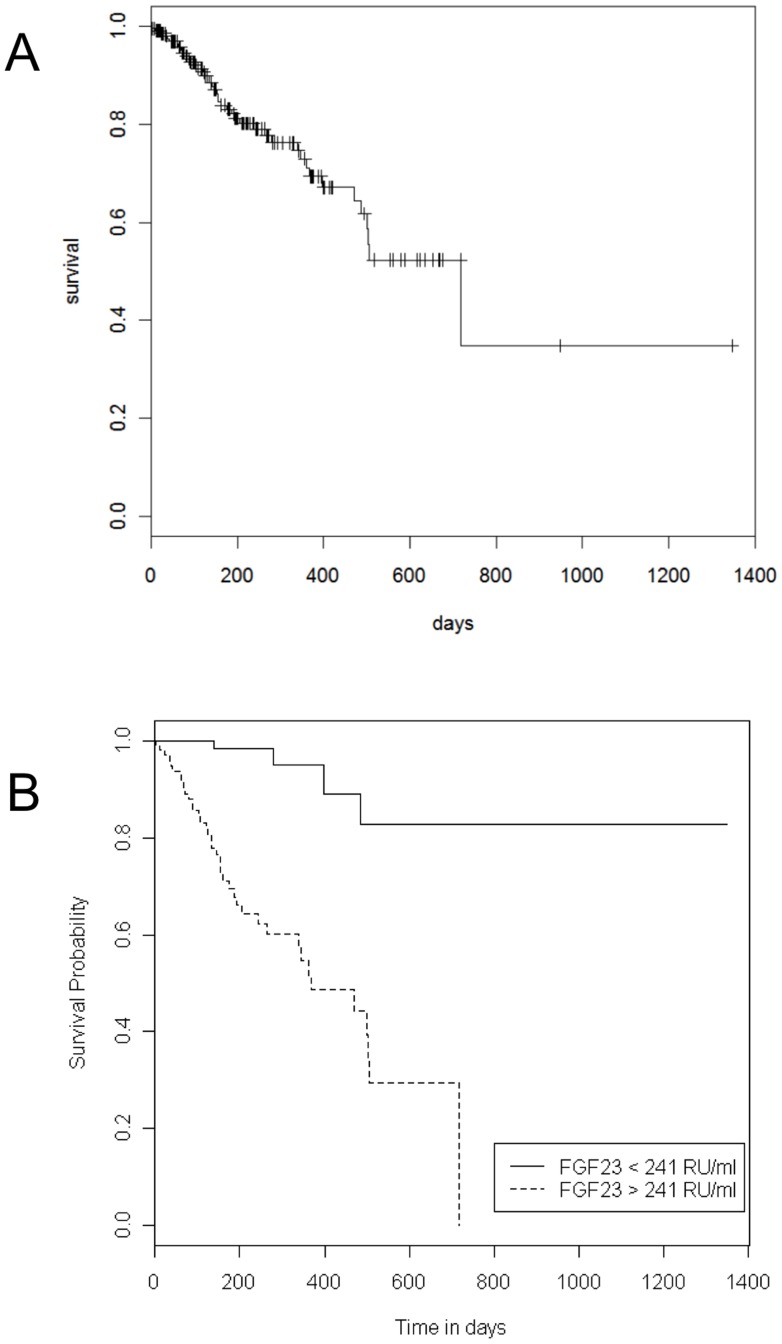
Figure 3. Patient survival according to plasma FGF23 concentration at the time of registration on the transplant waiting list.
(A) Kaplan-Meier survival-plot for patients on the liver–transplant waiting list. (B) Patient survival in relation to plasma FGF23 concentration measured at the time of the registration on the transplant waiting list. Dashed line represents FGF23 concentration >241 RU/ml and plain line FGF23 concentration ≤241 RU/ml.

