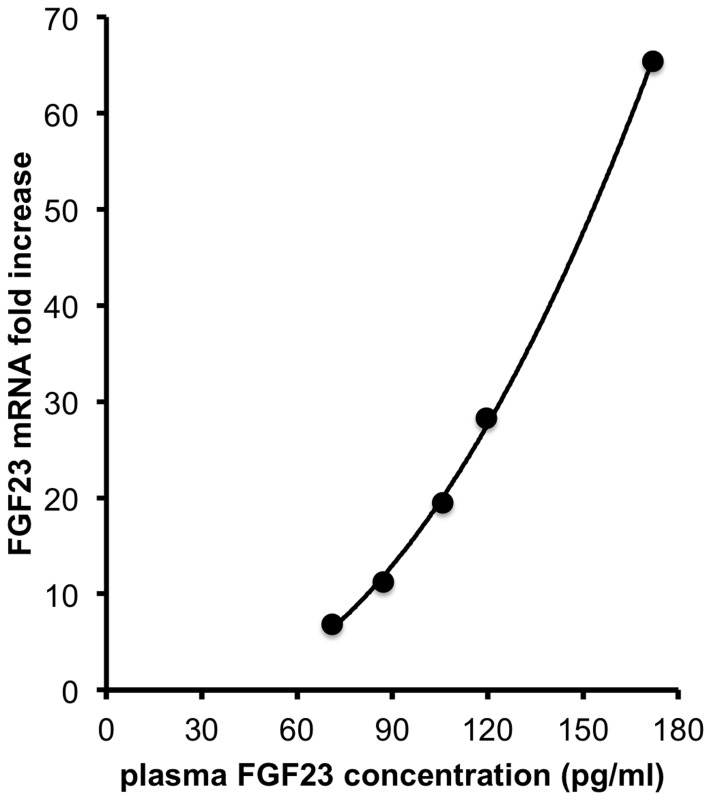
Figure 5. Correlation of plasma FGF23 concentration with liver FGF23 mRNA expression in DEN treated mice at month 9.
Plasma FGF23 concentration and FGF23 mRNA expression were measured in 5 mice 9 month after a single injection of DEN. The best fitting was obtained with a second order polynomial curve (R2 = 0.9993). The best fitting equation was determined by GraphPad Prism 5 for mac.

