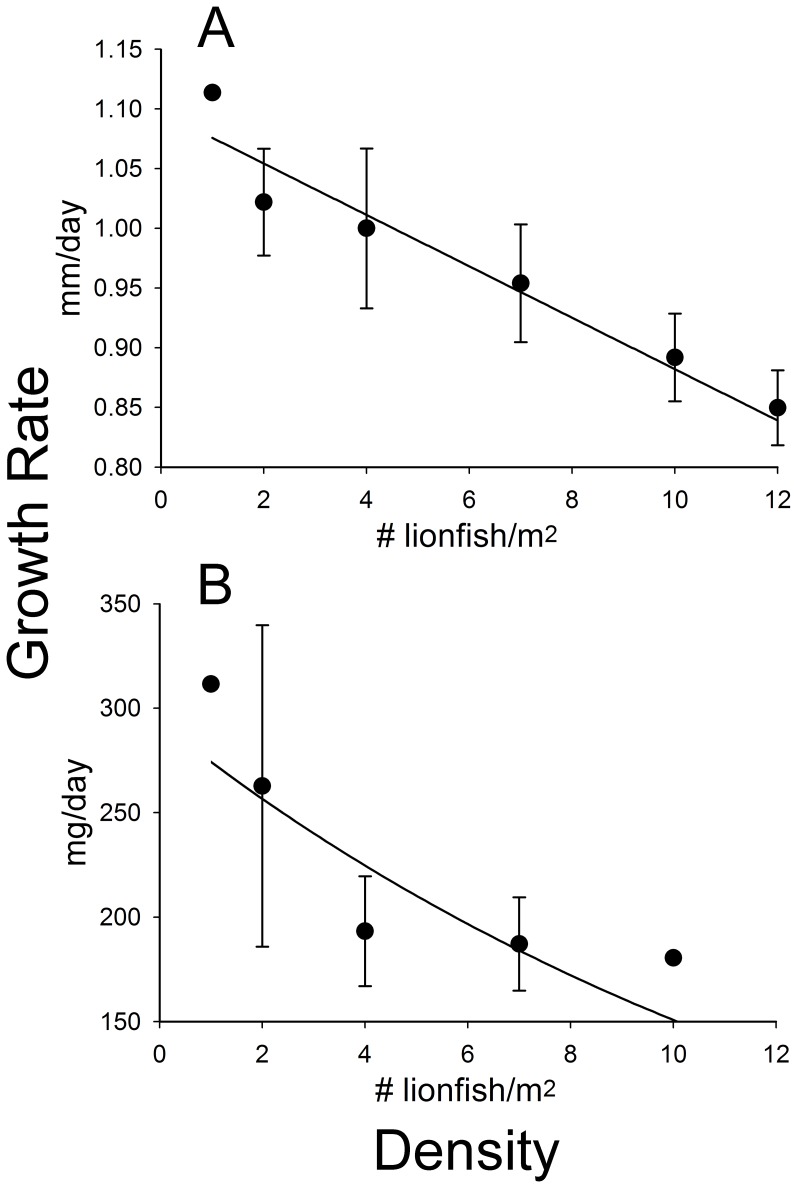
Figure 1. Effect of density on individual lionfish growth rates.
Invasive lionfish growth rate in (A) length (mm/day) decreased linearly with increasing density throughout the 8-week experiment, while lionfish growth rate in (B) mass (mg/day) decreased exponentially. Points represent mean ± SEM. Curves show fitted regression lines from (A) a linear regression and (B) a non-linear regression using an exponential decline function. Sample sizes (# lionfish): (A) n for each point is: 1, 2, 4, 7, 10, and 12, respectively. (B) n for each point is: 1, 2, 3, 6, and 1, respectively.

