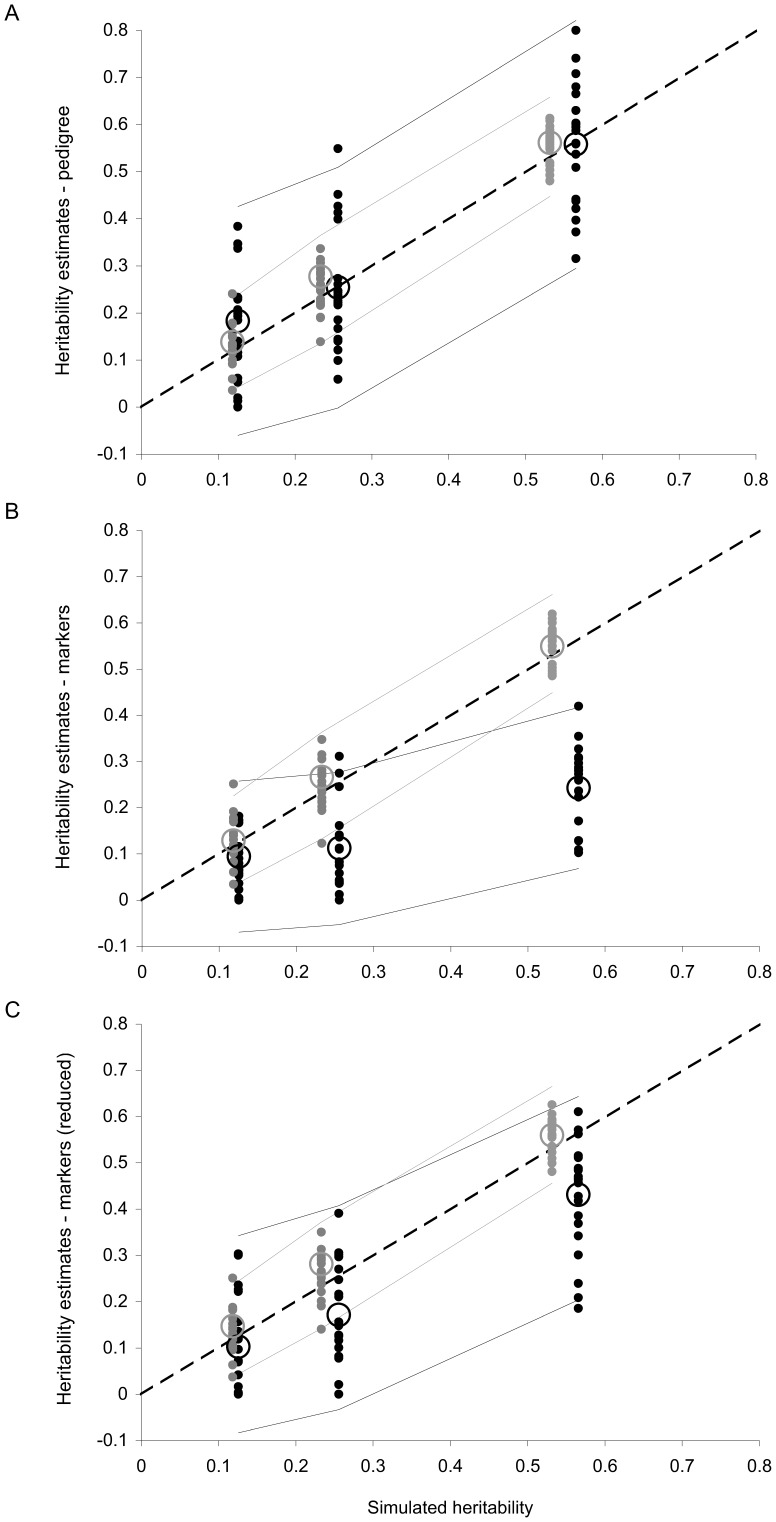
Figure 2. Simulation results testing the accuracy of pedigree or marker-based methods to estimate heritability.
This figure shows the correlation between the heritability simulated and heritability estimates obtained using pedigree-based animal models (A), marker-based animal models (B) or marker-based relatedness coefficients truncated before the analysis (C). Each dot stands for a simulated population, with 90% selfing (in grey) or complete outcrossing (in black). Circles stand for means across 20 replicates and solid lines show the 95% confidence intervals, as estimated by Asreml (and averaged across replicates). The dashed lines represent y = x.

