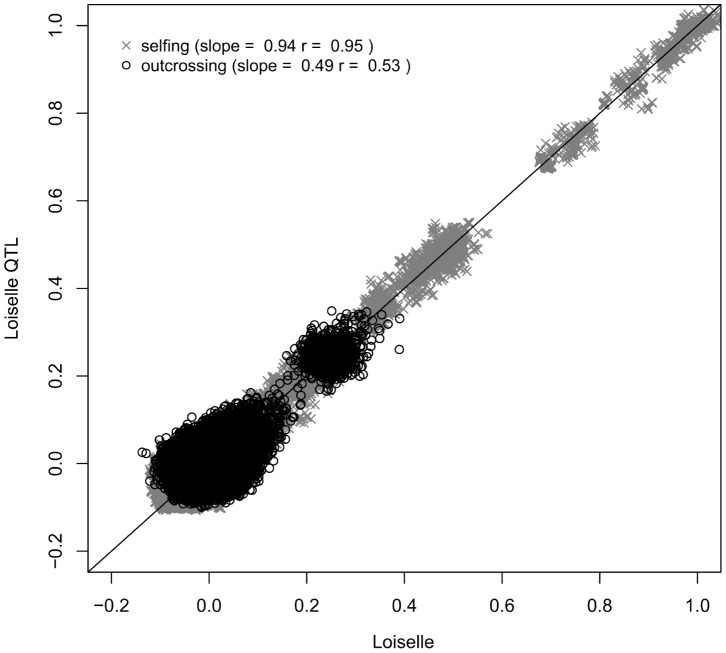
Figure 4. Relatednesses at causal and marker loci are more closely correlated in selfing than in outcrossing populations.
Regression between pairwise Loiselle coefficients estimated using 1500 SNPs and pairwise Loiselle coefficients estimated using the allele frequency at QTLs determining the phenotypic trait. Outcrossing populations are shown in black and selfing populations (selfing rate 90%) in grey. The legend indicates the slope of the regression and the correlation coefficient r. The slope is expected to be close to one if the relatedness at causal loci is accurately predicted by the relatedness at observed SNPs.

