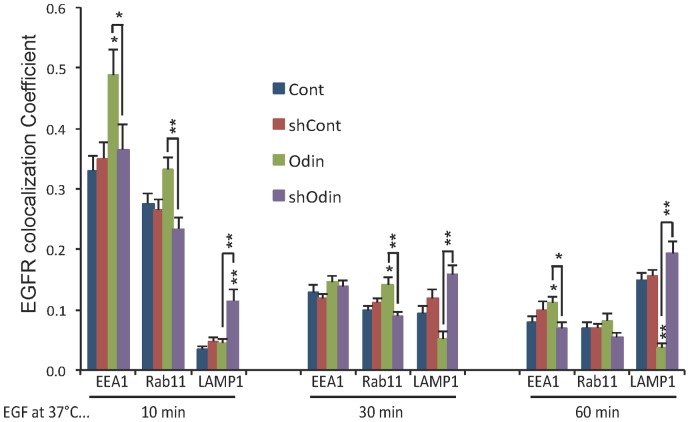
Figure 4. The effect of Odin expression on EGFR trafficking.
EGFR co-localization with EEA1, Rab11, and LAMP1, after the indicated incubation time with EGF was quantified by using Volocity software (Perkin Elmer). Co-localization coefficients (mean ±SEM, n = 10) represent pixel overlap between EGFR and EEA1, Rab11, or LAMP1. The coefficient ranges from 0 to 1, with 0 corresponding to non-overlapping images and 1 corresponding to 100% overlap. Asterisks above bars indicate a statistically significant difference from control (Odin v. Cont; shOdin v. shCont); and asterisks above connecting lines indicates the significance of the difference between the connected bars: * p<0.05; ** p<0.01.

