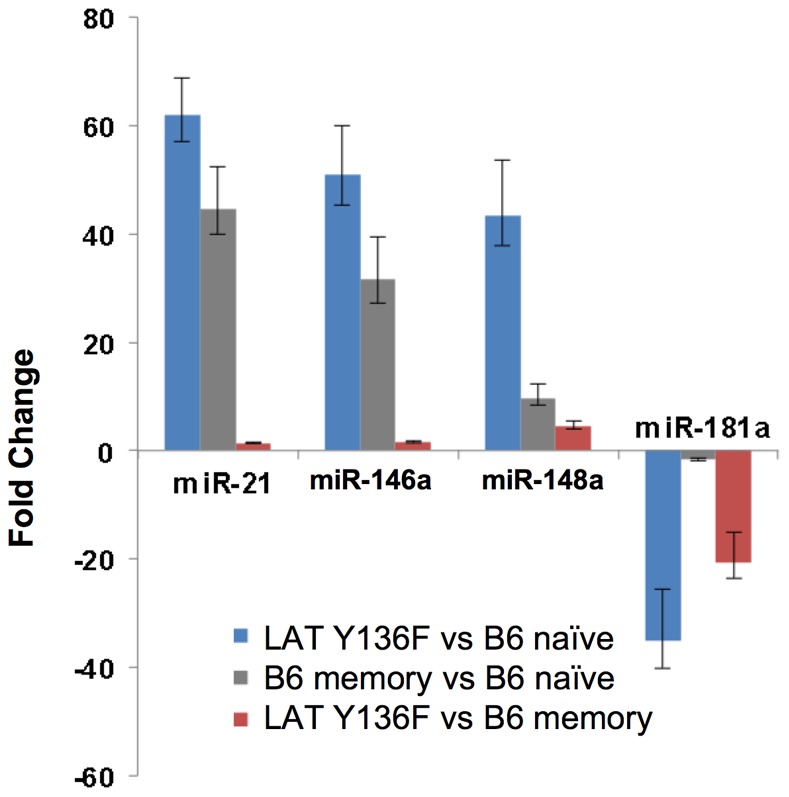
Figure 2. miRNA expression levels among replicate samples.

RNA from sorted CD4+ T cells from replicate samples (RNA from sorted CD4+ T cells from n = 3 groups of 5 to 8 pooled C57BL/6 mice or from n = 4 individual LAT Y136F mice) was reverse transcribed and subjected in quadruplicate to qPCR analysis as described in Materials and Methods. Bars represent fold changes of LAT Y136F vs C57BL/6 naïve (blue bars), C57BL/6 memory vs C57BL/6 naïve (gray bars) and LAT Y136F vs C57BL/6 naïve (red bars) with upper and lower error bars indicating error between individual mice or groups of mice. Relevant P-values can be found in Table S3.
