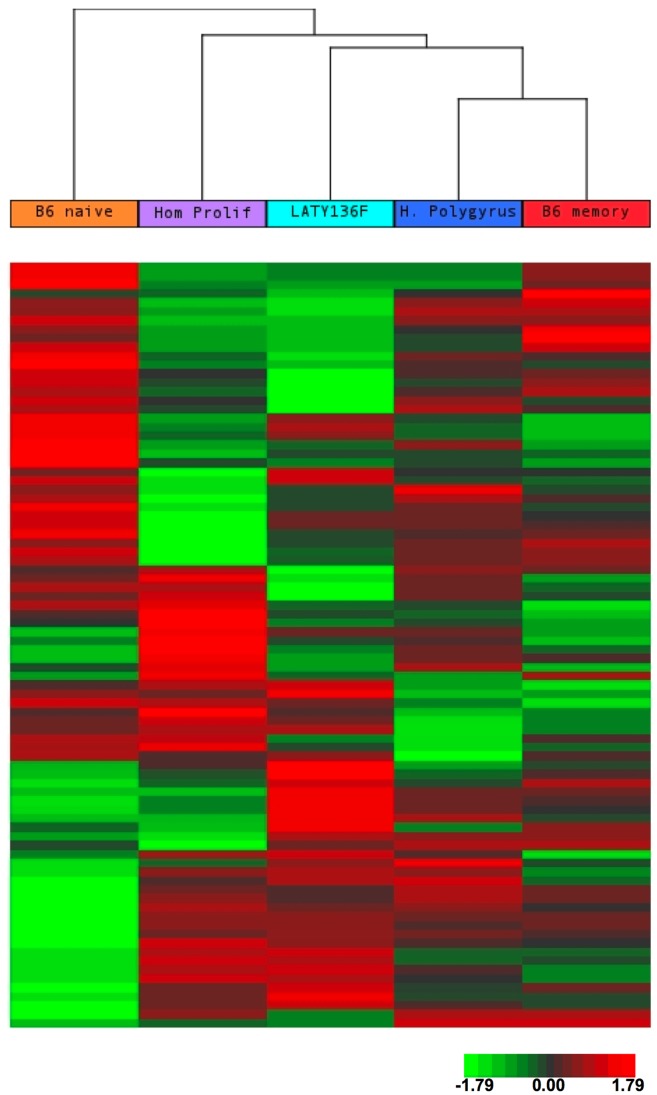
Figure 3. Unsupervised cluster analysis of miRNA expression among proliferating CD4+ T cells and CD4+ T cells from C57BL/6 mice.
miRNA expression in T cells undergoing proliferation during helminth infection, lymphoproliferative disease, and homeostatic proliferation are compared to miRNA expression in naïve and memory T cells from wild type, C57BL/6 mice. 86 miRNAs (in rows, listed in Table S5) that passed the minimum intensity filter are clustered. Probes were median-centered and clustering was done using Euclidean distance and average linkage. Red indicates higher expression, green indicates lower expression, with respect to median.

