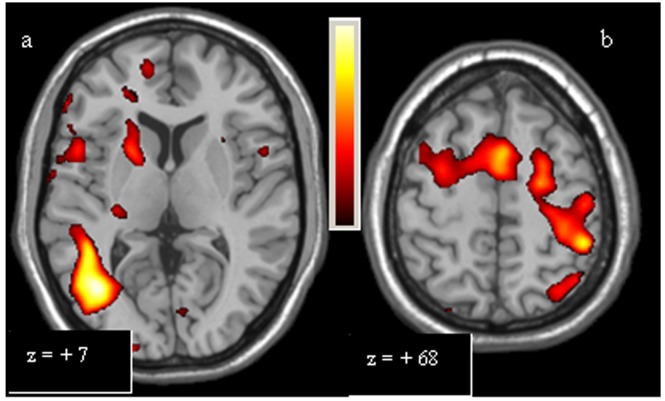
Figure 3. Single-task analysis Complex Scale, PD Patients > Controls.
The over-activations of right putamen, right inferior temporal cortex (a), left primary motor area, right dorsolateral prefrontal cortex, left posterior parietal cortex and rostral supplementary motor area (b) observed in patients, compared to controls, for Complex Scale, are shown. Colours bar range for F-score: 2 to 9,47.

