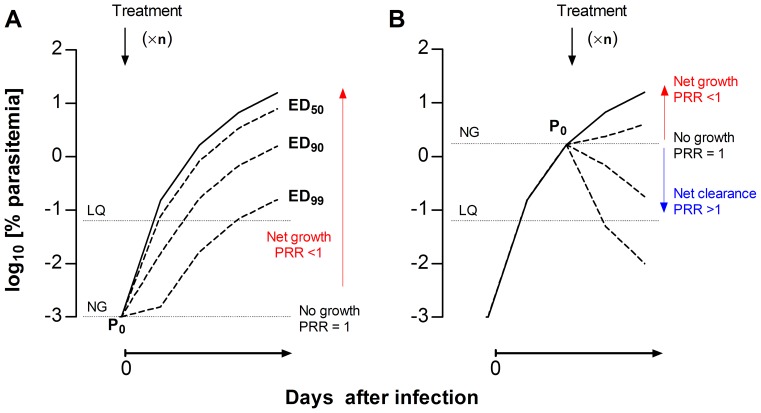
Figure 1. Concept of PNSA in vivo assays.
Comparison of the theoretical growth curves of Plasmodium berghei upon intravenous infection at day 0 under (A) a Peters’ 4-day test-type or (B) the PNSA assay format for the evaluation of the antimalarial efficacy of drugs. The solid curves represent the growth of parasites treated with vehicle. The dotted lines represent the growth of parasites under arbitrary treatments (×n, denotes arbitrary number of drug dosages) leading to ED50, ED90 and ED99, respectively. The parasitemia that marks the limit between net growth and net clearance of the parasite circulating in peripheral blood is denoted as the NG line. The limit of quantification of parasitemia is denoted as the LQ line. PRR is the parasite reduction ratio, i.e. the ratio of the baseline parasite count to that following treatment.

