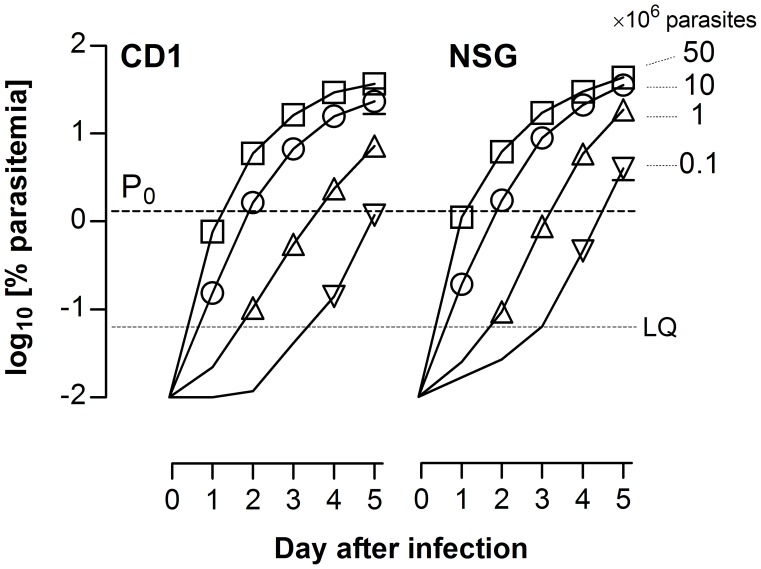
Figure 2. Selection of the infective dose for thePlasmodium berghei ED90-normalized in vivo assay.
Growth kinetics of P. berghei following intravenous infection of (A) immunocompetent CD1 or (B) immunodeficient NSG mice is shown. The plots show the parasitemia in peripheral blood of female mice infected with 0.1×10⁶, 1×10⁶, 10×106, and 50×106 infected erythrocytes. The dashed line (P0) indicates the target human-equivalent parasitemia. Data are the mean ± standard deviation of n = 4 mice/group. Error bars are shown only if they are bigger than symbols.

