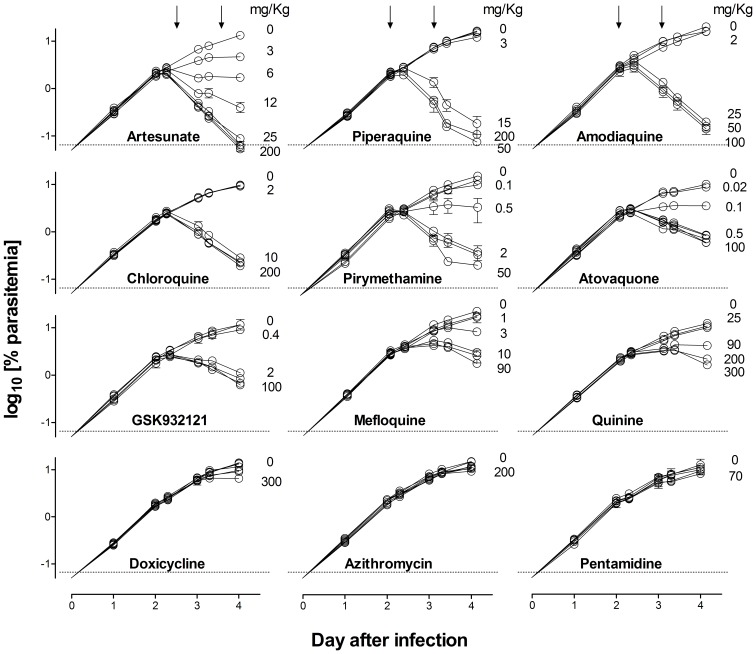
Figure 3. Plasmodium berghei clearance upon antimalarial treatment.
The plots show the kinetics of parasitemia in peripheral blood of CD1 female mice infected with 10×106 infected erythrocytes at day 0 and treated at days 2 and 3 (downward arrows) with a set of antimalarial drugs used for validation of the P. berghei ED90-normalized in vivo assay. For clarity, only selected doses are explicitly indicated in the plot. Data are the mean ± standard deviation of n = 3 mice/group. Error bars are shown only if they are bigger than symbols.

