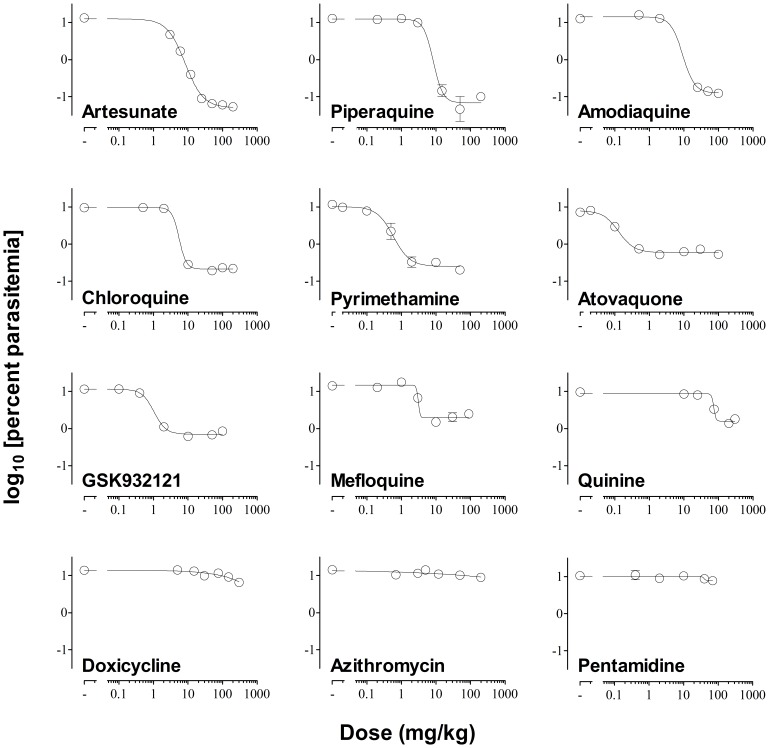
Figure 4. Best-fit dose–response curve.
The plot shows the log10 [parasitemia at day 4] versus log10 [dose administered in mg/kg] of a set of antimalarial drugs used for validation of the Plasmodium berghei ED90-normalized in vivo assay. A minimum of five dose levels of each drug were used to fit the dose–response functions. The dotted line indicates the mean ED90 estimated for each drug.

