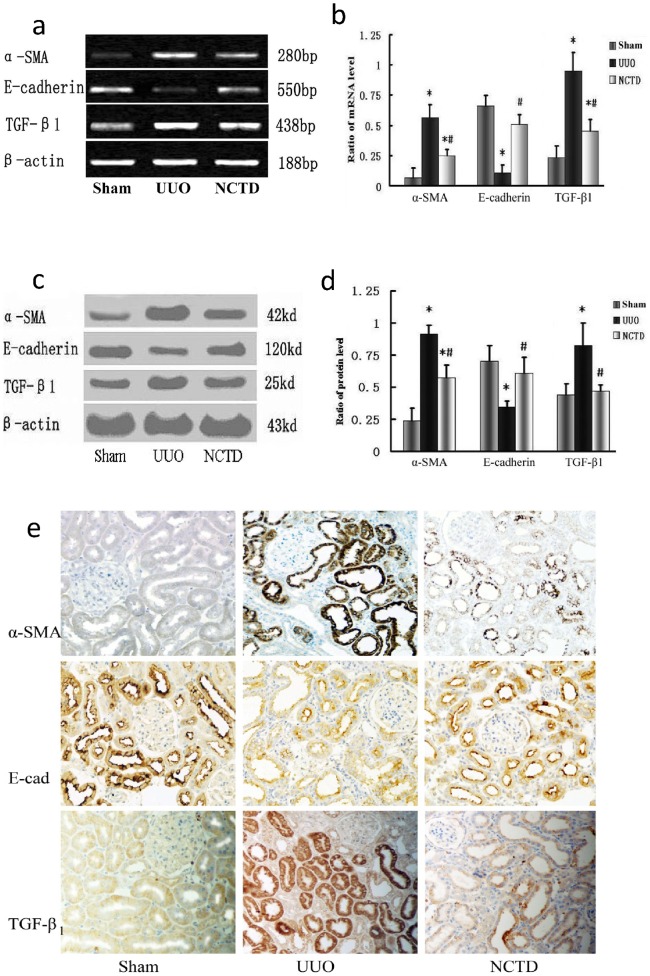
Figure 1. NCTD regulates the expression of α-SMA, E-cadherin and TGF-β1 in a rat UUO model.
(a and b) Representative RT-PCR results (a) and graphic presentation (b) show α-SMA, E-cadherin and TGF-β1 mRNA in different treatment groups.* P<0.05 vs. sham group and #P<0.05 vs. UUO group. (c and d) Representative Western blot (c) and quantitative data (d) for α-SMA, E-cadherin and TGF-β1 protein expression in various groups. * P<0.05 vs. sham group and #P<0.05 vs. UUO group. (e) Immunohistochemical staining shows α-SMA, E-cadherin and TGF-β1 protein expression in the rat kidney of different treatment groups (×200).

