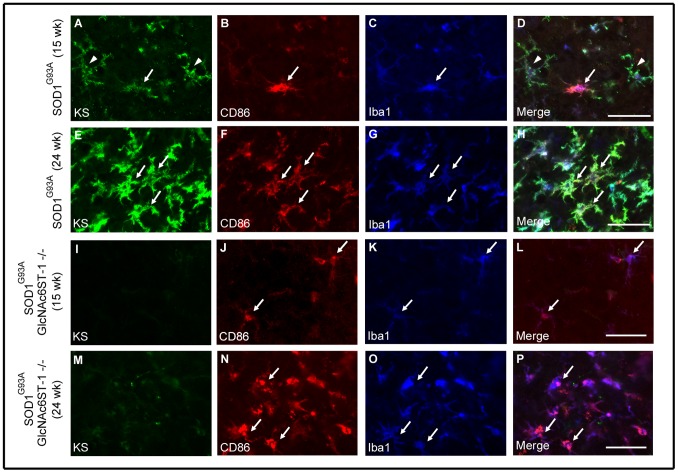
Figure 9. M1 microglia expanded as the disease progressed.
The spinal cord sections of SOD1G93A mice and SOD1G93AGlcNAc6ST-1−/− mice at 15 and 24 weeks were stained with KS (A, E, I, M), M1 marker CD86 (B, F, J, N), and microglia marker Iba1 (C, G, K, O). Arrows in A-H, KS+CD86+ microglia; arrows in J-P, KS–CD86+ microglia; arrowheads, KS+CD86− microglia. Bars, 50 µm.

