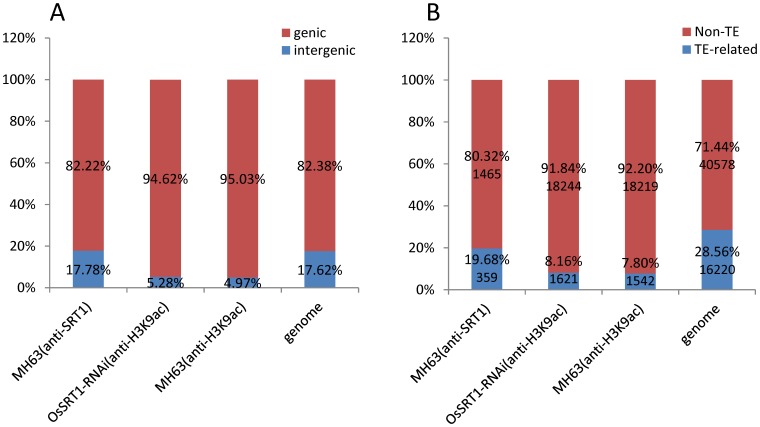
Figure 1. Distribution of H3K9ac and OsSRT1 ChIP-seq read peaks in the genome.
A. Distribution of OsSRT1 ChIP-seq (in wild type MH63 plants) and H3K9ac ChIP-seq (in OsSRT1 RNAi and wild type MH63 plants) read peaks in genic versus intergenic regions. Genic region contains the gene body and 2Kb upstream/downstream regions. B. Distribution of ChIP-seq read peaks in transposable element (TE)-related genes versus non-TE genes.

