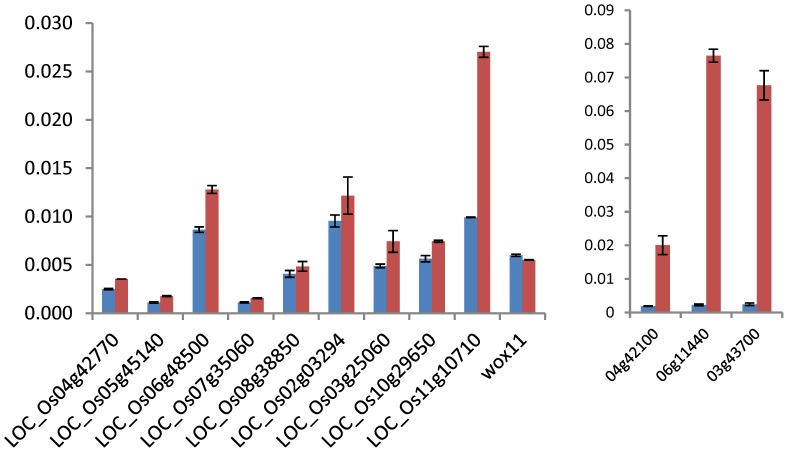
Figure 4. ChIP-PCR tests of H3K9ac on 12 genes in wild type and RNAi plants.
Red bars represent the wild type and blue bars represent the RNAi plants. Nine non-TE (left) and 3 TE-related (right) genes were randomly selected. OsWOX11 on which H3K9ac was not detected in the ChIP-seq data was used as a negative control. y axis: values relative to input signals.

