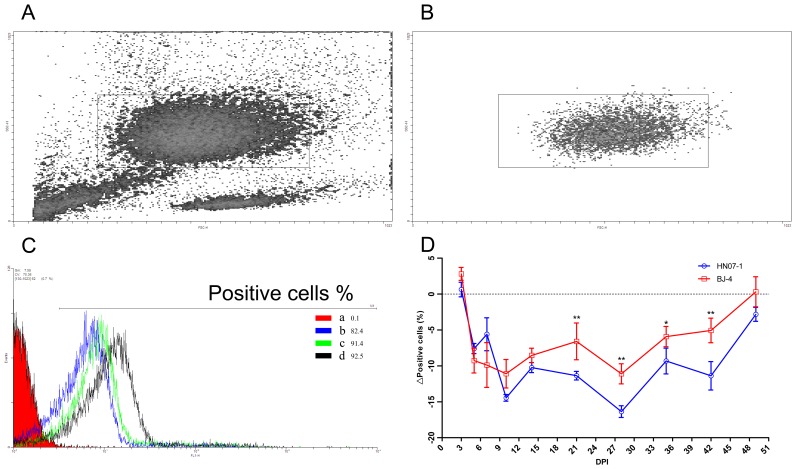
Figure 1. Immune complex adhesion assays.
A. Scatter plot from a suspension containing erythrocytes and PMNs, the gate identifies PMNs. B. Only PMNs are indicated in the final preparation following lysis. C. Fluorescence intensity of gated neutrophils following incubation with FITC-labeled ovalbumin-Ig complex at 42 DPI. a, negative control, PMNs isolated from a control piglet, were incubated with medium alone. b, binding of IC by PMNs of a piglet pre-inoculated with HN07-1. c, binding of IC by PMNs of a piglet pre-inoculated with BJ-4. d, binding of IC by PMNs of a piglet of mock-infected control group. D. Time course of the down-regulation of IC surface binding by porcine PMNs following pre-inoculation with either PRRSV strain. The percentage of inhibition was calculated by the following formula: % Positive cells inoculation-%Positive cells mock-infected control. Results are shown as mean ± SE (n = 5). *, p<0.05. **, p<0.01.

