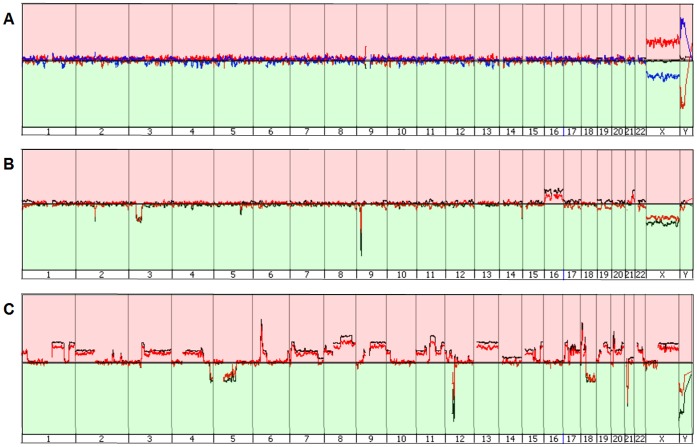
Figure 2. Genome wide aCGH profiles of gDNA and associated amplified single cell DNA from healthy controls, REH and OE19.
Peaks upstream the baseline (red area) denote a gain, peaks downstream the baseline (green area) indicate a loss of chromosomal material. A) Healthy control black line = gDNA, red line = female single cell vs. male single cell, blue line = male vs. female single cell. B) REH black line = gDNA, red = single cell. C) OE19 black line = gDNA, red = single cell.

