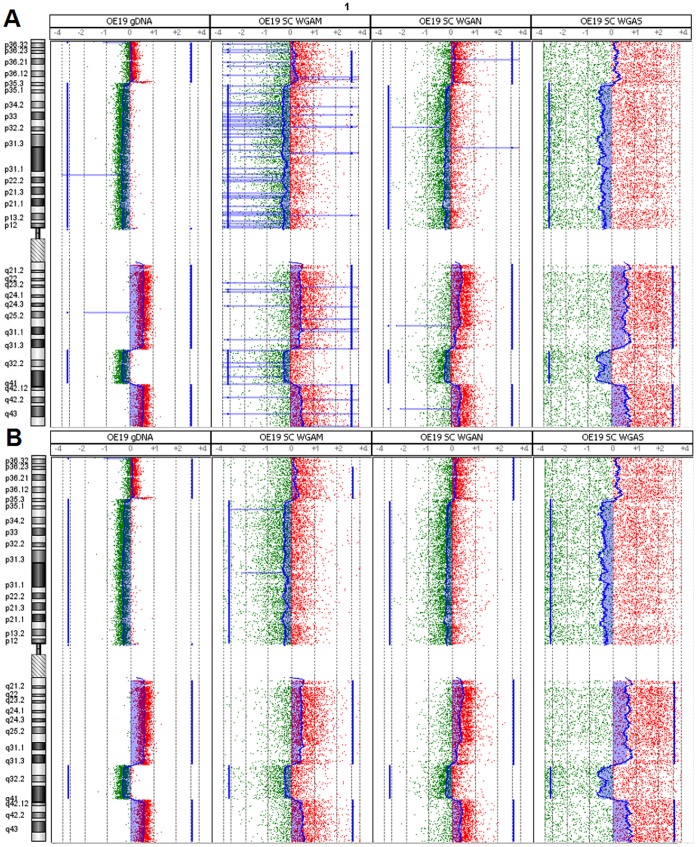
Figure 3. Effect of custom aberration filter.
Visualization of chromosomal alterations on chromosome 1 in Genomic Workbench using aberration detection algorithm ADM-2. Blue filled areas denote a gain (right) or loss (left) of chromosomal material. A) Analysis of gDNA, WGAM-, WGAN- and WGAS-single cell amplified DNA without aberration filter. B) Analysis of the same samples with aberration filters (≥3 consecutive oligonucleotides, ≥ log2ratio ±0.25).

