
Figure 3. Population structure ofEuptelea pleiospermum estimated by the programs STRUCTURE 2.3.4 (A) and TESS 2.3.1 (B).
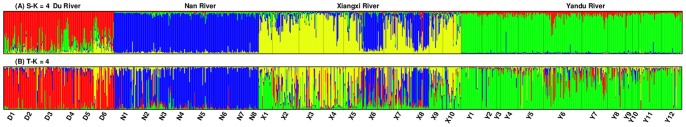
Each individual is represented by a thin vertical line, which is partitioned into four colored segments that represent the individual’s estimated membership fractions in the four clusters. Black vertical lines separate individuals of different populations. Labels below the plot provide population codes, which are the same as in Table 1. Labels above the plot (Du River, Nan River, Xiangxi River and Yandu River) are sampling information.