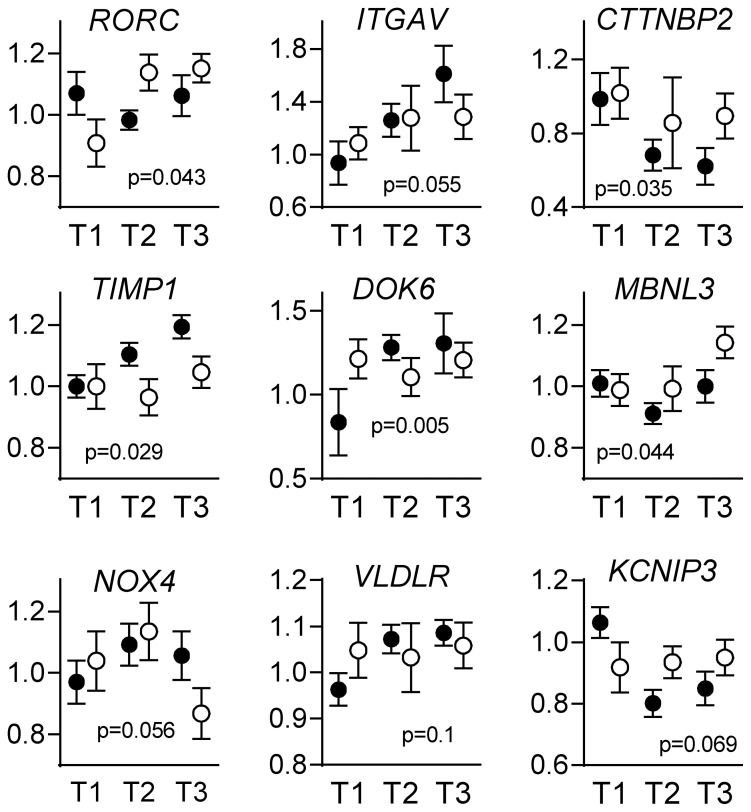
Figure 2. Quantitative real time RT-PCR of selected gene transcripts in somatotroph adenomas, which supported an interaction between E-cadherin expression levels and SA treatment.
The transcripts of (A) RORC (B) ITGAV (C) CTTNBP2 (D) TIMP1 (E) DOK6 (F) MBNL3 (G) NOX4 (H) VLDLR and (I) KCNIP3 in 65 growth hormone-producing adenomas were selected based on the interaction between E-cadherin and SA (p<0.1, interaction tested with continuous E-cadherin, but presented as tertiles), quantified and distributed according to tertiles of E-cadherin mRNA expression (normalized to GAPDH mRNA levels and expressed as relative mRNA levels). The results are presented as the mean ± SEM and presented relative to tertile 1. P-values represent the interaction between E-cadherin and SA in the univariate analysis.

