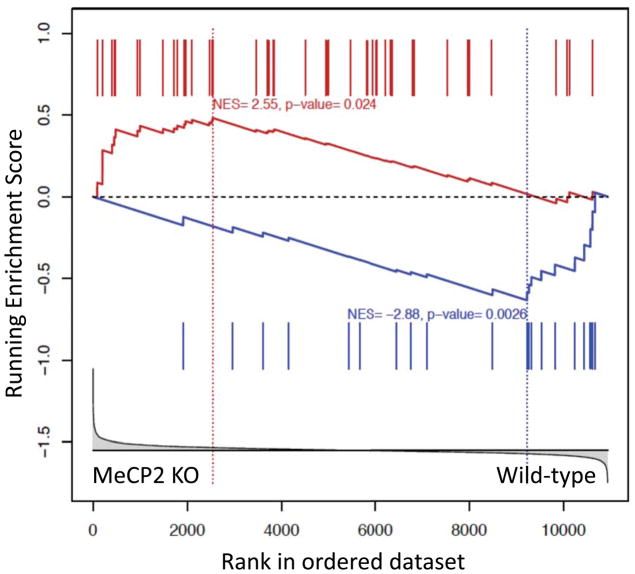
Figure 5.
MeCP2 and alcohol regulate overlapping gene expression programs. GSEA was used to compare the alcohol-induced gene expression changes in the cortex of wild-type mice (Repunte-Canonigo et al., 2010) to gene expression differences in the cortex of MeCP2 null vs. wild-type mice (Urdinguio et al., 2008). GSEA indicates that genes differentially expressed by alcohol in the cortex are enriched in differentially expressed genes in the cortex of MeCP2 null vs. wild-type mice (NES=2.55, p=0.024 for genes with increased expression by alcohol and NES=−2.88, p=0.0026 for genes with decreased expression). In particular, the expression data set from the comparison of MeCP2 null vs. wild-type mice was ranked based on the t-statistics (X-axis, bottom panel) and interrogated with 2 gene sets consisting of the differentially expressed genes showing increased expression in response to alcohol administration (red bars show their location in the ranked gene set of MeCP2 regulated genes) or decreased expression in response to alcohol administration (blue bars). The plots in each of the panels represent the enrichment score (ES, Y-axis) of genes with increased (red plot) or decreased (blue plot) expression in response to alcohol administration in the list of genes ranked by their differential expression in the cortex of MeCP2 null and wild-type mice. The asymmetrical distributions observed for ES (red higher toward the left-hand side and blue lower toward the right-hand side) indicates their enrichment in the dataset of MeCP2 regulated genes. The vertical dotted lines, also called leading edges, indicate the points at which the running ES reach their maximum scores.

