Figure 5.
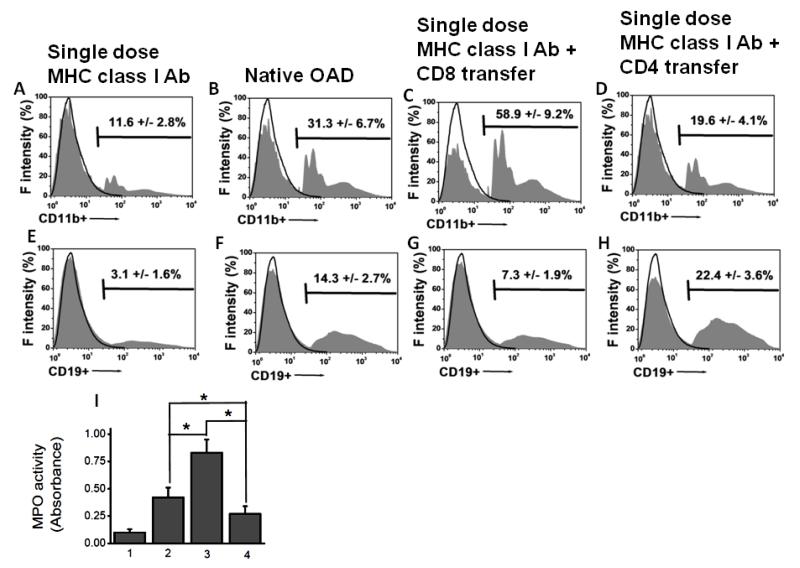
Analyses of the frequency of the phenotype of the infiltrating cells on day 30 following adoptive transfer of T cell subsets from OAD (following administration of 200 μg of Abs to MHC class I intrabronchially to C57Bl/6 mice on days 1, 2, 3, and 6, and weekly thereafter) into naïve animals with single dose of Abs to MHC class I. (A-D) Analyses of CD11b+ infiltrating cells, representing monocyte/macrophage infiltration. The frequency of CD11b+ infiltrating cell phenotype among various groups include: sub optimal single dose MHC class I Abs group = 11.6±2.8% (A); native OAD group= 31.3±6.7% (B); CD8 transfer along with single dose MHC class I Abs administration group = 58.9±9.2% (C); and CD4 transfer along with single dose MHC class I Abs administration group = 19.6±4.1% (D). There was a statistically significant difference between the native alloimmune OAD and CD8 (p-value <0.05); CD8 and CD4 (p-value <0.01), and the native alloimmune OAD and CD8 (p-value <0.05) groups. (E-H). Analyses of CD19+ infiltrating cells, representing B-cell infiltration. The frequency of CD19+ infiltrating cell phenotype among various groups include: suboptimal MHC class I Ab group = 3.1±1.6% (E); native alloimmune OAD group = 14.3±2.7% (F); CD8 transfer along with single dose MHC class I administration group = 7.3±1.9% (G); and CD4 transfer along with single dose MHC class I Abs administration group = 22.4±3.6% (H). There was a statistically significant difference between the native alloimmune OAD group and CD8 group (p-value <0.05); CD8 and CD4 (p-value <0.01), and native alloimmune OAD group and CD8 (p-value <0.05) groups. (I) MPO assay on the infiltrating cells, representing neutrophil infiltration. The absorbance value (ΔOD) of the infiltrating cells among various groups include: suboptimal single dose MHC class I Abs administration group = 0.11±0.03; native alloimmune OAD group = 0.42±0.09; CD8 transfer along with single dose MHC class I Abs administration group = 0.83±0.12; and CD4 transfer along with single dose MHC class I Abs administration group = 0.27±0.07. There was a statistically significant difference between the native alloimmune OAD and CD8 (p-value <0.05); CD8 and CD4 (p-value <0.01), and native alloimmune OAD and CD8 (p-value <0.05) groups. Data were collected from 5 different animals and presented as mean ± SEM. The significance (p-value <0.05) was determined by student t-test; and represented by asterick (*).

