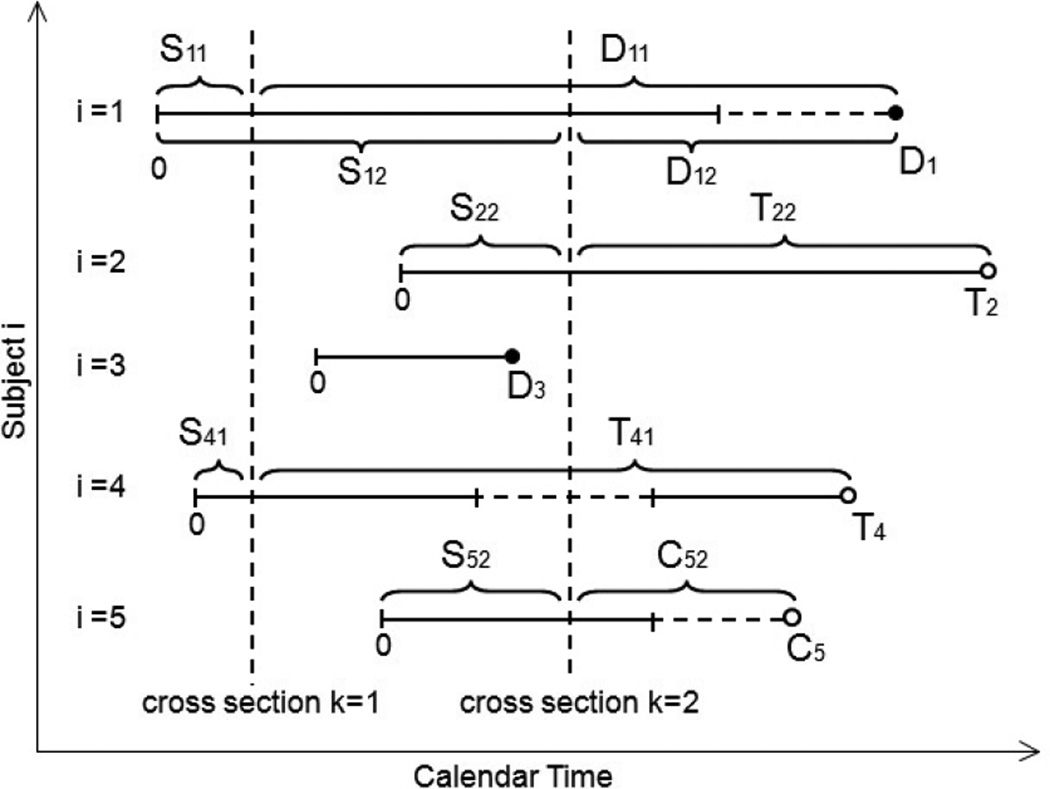
Figure 1. Examples of the relationship between cross-section time and follow-up time.
Vertical dashed lines denote cross-section dates (k = 1, 2), while horizontal dashed lines denote treatment-ineligible periods. Subject i = 1 is included in both cross-sections k = 1 and k = 2 and contributes death times D11 and D12 to the analysis. Subject i = 2 is treated at time T22 and, hence, censored (perhaps dependently) at that time. Subject i = 3 is not included in either cross-section. Subject i = 4 is included in cross section k = 1, but not cross section k = 2 due to treatment-ineligibility. Subject i = 5 is censored at time C52 from cross section k = 2. Note that subjects i = 1 and i = 5 are not censored after becoming treatment-ineligible.

